By: Kim Geiger
Dean Johnson will share his knowledge on Husky Bites, a free, interactive Zoom webinar Monday, February 27 at 6 p.m. ET. Learn something new in just 30 minutes or so, with time after for Q&A! Get the full scoop and register at mtu.edu/huskybites.
What are you doing for supper this Monday, February 27 at 6 p.m. ET? Grab a bite with Dean Johnson, dean of the College of Business at Michigan Tech. Joining in will be recent graduates Jada Hamar and Kasey Kangas, plus current student Jaharee Weah—all three took part in the Applied Portfolio Management Program (APMP), directed by Dr. Johnson.
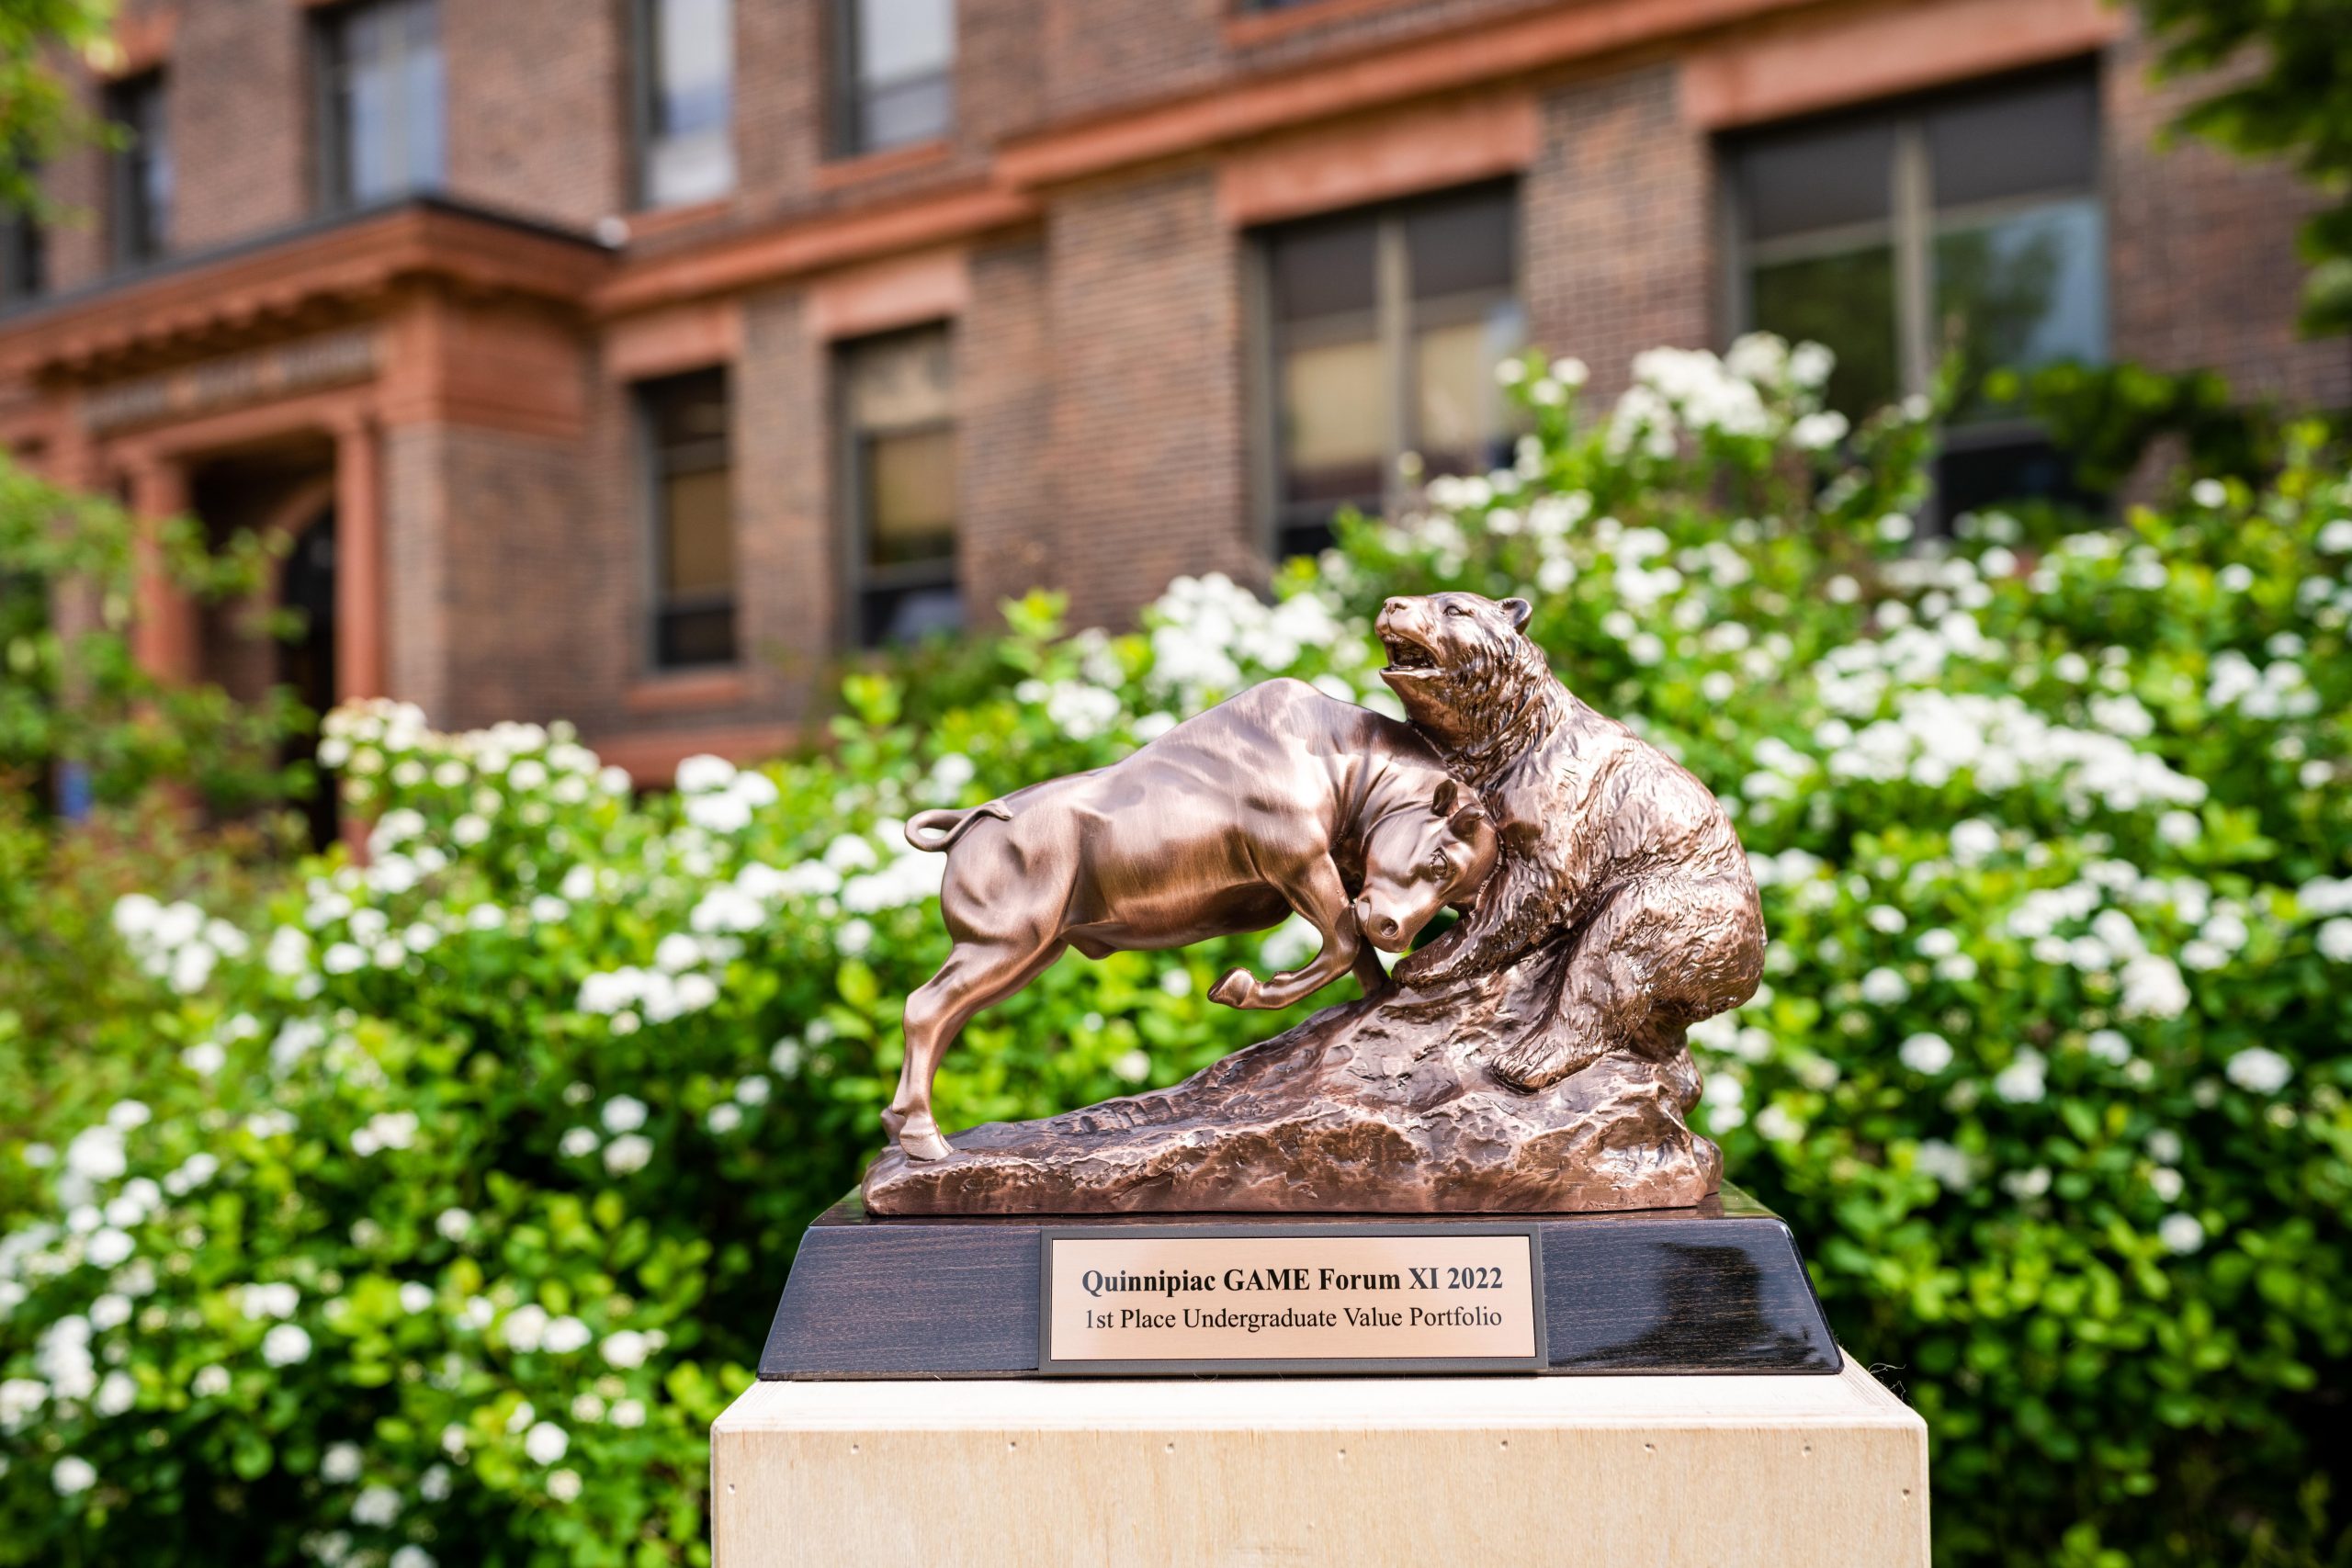
In the 20-plus years since APMP’s founding, teams of Huskies have grown the portfolio into one of the top 50 undergraduate funds in the nation. Students in the program have opened the Nasdaq Stock Exchange and become regulars on CNBC. And although APMP is a for-credit class, the intensive experience often becomes much more of a commitment—and reward.
During Husky Bites, Dr. Johnson also promises to share their secret recipe of 25 years—the one that’s been guiding these Michigan Tech students as they manage real money.
“In addition, we’ll consider paradigms, paradoxes, performance, and persistence, while exploring the history of investment theory and practice from the 1920s to the 2020s,” he says.
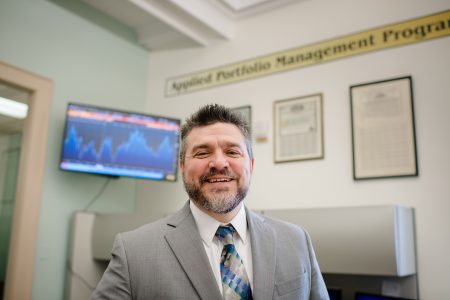
As a PhD student, Johnson interviewed for his first faculty position at Michigan Tech with a very clear vision. “Right away, I intended to establish a portfolio management program for students,” says Johnson, who was hired on as faculty in 1996 in Michigan Tech’s School of Business. He became dean in 2016.
Back in 1996, giving college students a large sum of real money to manage in financial markets was a particularly novel—and perhaps risky—idea, and Michigan Tech was just the place. And there were alumni, donors and Michigan Tech Fund board members helping along the way.
In 2019, Michigan Tech’s School of Business became its College of Business. “We offer a broad range of degrees, including four graduate degrees,” notes Johnson. “Our program has been accredited for nearly two decades,” he said. “College imparts the prestige indicative of our history, value and offerings—from our top faculty and technology-infused business core, to our esteemed alumni network.”
“Michigan Tech is an exceptional STEM university that provides us with a unique ability to bridge business and technology.”
Each year, a new group of Michigan Tech students is selected to lead APMP for one calendar year, managing more than $2 million in real money in US stock and bond markets. Students are chosen for the program based on their demonstrated aptitude and leadership skills in the area of finance, accounting, and financial economic theory.
Jada, Kasey, and Jaharee not only took part in the APMP together, but were also in many of the same finance classes together at Tech.
Dr. Johnson, how did you first get into your field? What sparked your interest?
I was fascinated by stock prices at a very young age. The flow of capital to fund firms providing the goods and services most in-demand by society is the key to improving the standard of living for all.
Hometown, family, hobbies?
I live here in Houghton, Michigan. I’m married with three children. I enjoy the outdoors and sports in my spare time.

Jada, how did you first get into your field? What sparked your interest?
My dad attended Michigan Tech for finance. He’s a local banker. I didn’t initially want to follow in his footsteps until I took my first business class. I quickly realized that finance was the route I wanted to take. I enjoyed the challenge of the classes, and the number of career paths available with a finance degree was really exciting. I graduated from Michigan Tech with a BS in finance this past December. I accepted a position at Ameriprise Financial in Houghton.
Hometown, family? What do you like to do in your spare time?
I feel lucky to have grown up in this area and be able to continue my education here, too. I am the oldest of six kids, with two younger brothers and three younger sisters. I enjoy time outdoors with my husband and our two dogs—skiing in the winter, and fishing in the summer. We have a five-year-old Goldendoodle, Arlo, and Indy, a seven-month-old yellow lab.

Kasey, how did you first get interested in business?
I took a business introduction class in high school and thought it was fun. My teacher recommended I take her accounting class, so I did—and I loved it! Now I’m an accountant at Aspirus Keweenaw Hospital.
Hometown, family?
I grew up in Calumet, Michigan. I have five brothers and five sisters.
Any hobbies?
I love hiking, camping, fishing, cooking, baking, reading, and playing guitar.
About the College of Business
The Michigan Tech College of Business offers undergraduate majors in accounting, business analytics, construction management, economics, engineering management, finance, management, management information systems, and marketing, as well as a general business option. Graduate degrees include the TechMBA®, a Master of Engineering Management, a Master of Science in Accounting, and a Master of Science in Applied Natural Resource Economics.