125: that is the number of days until US Election Day, 2024. On November 5, the 47th president of the United States will be decided. So while campaigns are in full swing, and pollsters are making predictions, this blog focuses on the role of statistics in the election process.
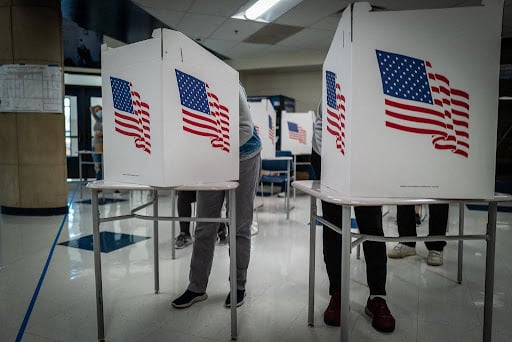
At their most basic, elections allow citizens to exercise representative democracy by selecting individuals to occupy public office. Those selected then make critical decisions that impact citizens. And these ballots that officials tally are then transformed into statistical data, ultimately determining the election’s result.
However, statistics play a part in the election process long before voters cast their ballots. That is, officials use statistics to forecast election results, inform campaign strategy, and micro-target individuals.
An understanding of how statistics are used in elections, then, can enhance transparency for voters, as well as encourage all citizens to advocate for data privacy and security. Additionally, those interested in mathematics, statistical applications, and political science might be interested in learning about how statistics impact elections.
Statistics in Politics
Throughout history, statistics have played an important role in politics. Government bodies used statistics in the election process to support the formal decision-making processes that determine who will fill offices in the legislature. However, technological advancements, the accumulation of data, and the maturation of statistical models have made elections increasingly complex.
For example, in the past, politicians and their supporters would cast a wider net when campaigning for votes. But today, data analytics and digital resources allow parties to collect information about the public and then hyper-personalize campaign targeting. As a result, modern elections require statistical experts who can manage and leverage data while maintaining ethical standards related to trust, security, and privacy.
Below are the most obvious three ways that statistics impact elections.
Election Forecasts
Those creating election forecasts use legally available data and statistics to inform the public about the probable outcome of an upcoming election. Political statisticians recruit this data, along with reporting, historical patterns, and academic research to create a detailed account of the Senate and House forecasts.
In the United States, this process includes disclosing the favored party, estimating the number of seats in each House, and predicting whether the outcome will result in a majority government. In short, statisticians use a forecasting model to transform large data sets into meaningful predictions for future outcomes
How to Build an Election Forecast Model
- Create a national database.
- Clean and layer the data.
- Plug the data points into a predictive model for forecasting.
Forecasting in Action
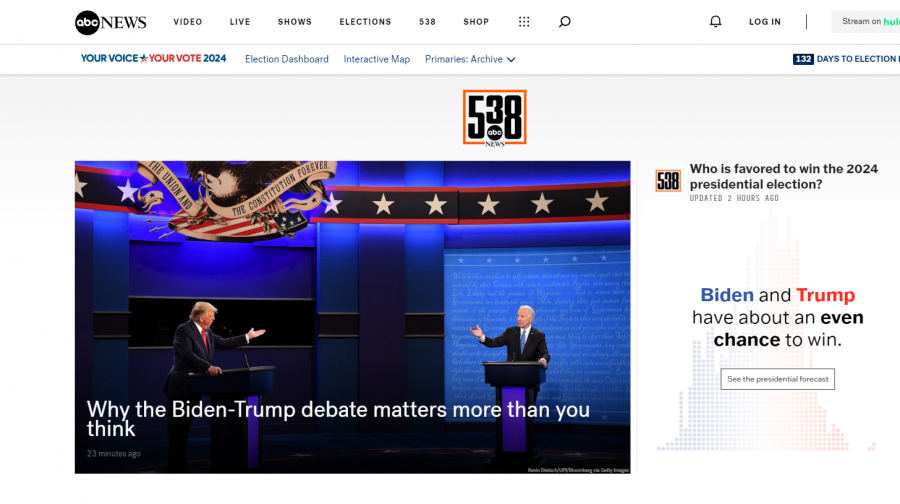
The popular website FiveThirtyEight, created by American statistician Nate Silver, is a staple of ABC News. The website’s primary objectives are advancing public knowledge and promoting transparency around voting outcomes.
To achieve these aims, it uses polling, economic, and demographic data to explore likely election outcomes. It also employs statisticians to build empirical statistical models for accurate election forecasts.
After the data is collected, experts then input it into Nate Silver’s forecast model. This model, which combines polling, economic, and demographic data, aims to provide an informed prediction rather than an unskilled guess.
And the website regularly updates its predictions too. For instance, on June 26, 2024, the site, after running 100 simulations, predicted that President Joe Biden and Donald Trump each had a 50% chance of winning the election. However, on July 2, 538 changed the prediction to 50% for Trump and 49% for Biden. And as the election nears, and uncertainty decreases, 538 claims its predictions will grow more accurate. This site exemplifies just one popular election forecast tool.
Election Campaign Strategy
The use of statistics in election campaigning has also changed dramatically. That is, historically, the only data that politicians and their supporters used to garner insights was that derived from the polls. In recent years, however, data and statistics have revolutionized election campaigns.
Today’s data-driven world offers campaign strategists a surplus of data points about past elections, voter preferences, and geopolitical influences. In addition, new communication platforms, such as social media, allow campaigns to profile their voters’ identities and needs. Statisticians can also harness publicly available data to inform campaign messaging, political priorities, and outreach.
Campaign research allows parties to investigate target audiences’ behaviors, attitudes, values, and beliefs to test campaign messaging, creativity, and delivery. According to The Commons Social Change Library, statisticians use the following quantitative and qualitative research methods to inform campaign strategy.
Quantitative Campaign Strategy Research
- Benchmark Polls
- Issue Polls
- Longitudinal Surveys
- Member Surveys
- CATI (computer-assisted telephone interview) polls
- Dial-testing
Qualitative Campaign Strategy Research
- Deep dive interviews
- Face-to-face focus groups
- Online focus groups
- Online communities
Once the previous research is complete, campaigners then test various messages. Alternatively, they might test the gap between their voters’ current stances and the desirable action. This job is a laborious one. Campaigners must strive for creating winning messages that make impactful arguments, define important issues, expose the opposition’s weak points, and tell compelling narratives.
Statisticians with a marketing background may excel in this area of research and persuasion. Why? They already have the foundational skills needed to create data-driven campaign strategies, from initial research to distribution.
Microtargeting in Elections
Before advanced data and statistics, campaigns often involved grass-roots approaches. These included direct mail, home visits, radio, television, and out-of-home marketing campaigns (ex., billboards, posters, etc.). Today, campaigns can leverage social media, digital marketing, and advanced data analytics to reach voters on their devices and tailor personalized messaging. This latter strategy is otherwise known as microtargeting.
In microtargeting, the audience is segmented into specific groups, with each group receiving a message that speaks to their likes and needs. This profiling, though, is not new.
Consumers are already accustomed to online stores such as Amazon, as well as social media (TikTok, Facebook) understanding their preferences.
For instance, you purchase one book and Amazon recommends a similar one. You buy running shoes (a lot) and you’re now in a fitness/running channel.
Similarly, political parties and election campaigns use microtargeting to communicate with voters about their initiatives. The goal is influencing voting outcomes in their favor.
How Microtargeting Works
Micro-targeting uses statistics in a similar manner to that of election forecasting. First, statisticians collect and clean data points from a national database. Then, they layer on publicly available information, including email addresses, phone numbers, employment, education, purchasing patterns, IP addresses, etc.
Next, statisticians use predictive models to indicate for whom a voter is likely to vote and how likely a voter is to change their voting preference. These models also predict how lifestyle choices, such as being single or married, might affect voting behaviors. Statisticians also investigate how voters’ values align with topical issues like gun control, the climate crisis, abortion, immigration, and so on.
After the analysis comes the categorization. Each group is sorted into different channels. Each audience (channel) then receives personalized campaign messaging based on their beliefs and inclinations. The purpose is delivering the right campaign message, to the right voter, at the right time. (At its roots, microtargeting is a very deliberate form of kairos. In rhetoric, kairos is the identification of the critical moment to deliver a finely tuned persuasive message or to take an action.)
The Risks of Microtargeting
Advanced microtargeting, of course, has its downsides. Take the most famous example, which began in 2014. Cambridge Analytica, a political consulting firm, obtained the private Facebook data of tens of millions of users. It then unethically sold psychological profiles of American voters to political campaigns.
How did this microtargeting scam work? 270,000 Facebook users played with the supposedly innocuous personality profile app called “This Is Your Digital Life.” This app, created by scientist and psychologist Alexsandr Kogan, allegedly collected 5,000 data points from each participant.
What’s worse: participants didn’t read between the lines. When users gave this third-party app permission to acquire their data, they also gave the app access to their friends’ networks. The more friends = the more data exposed.
Kogan then sold this data to Cambridge Analytica. As a result, the company illegally compiled the data of about 87 million users who had not explicitly given Cambridge Analytica permission. The firm then used up to 50 million profiles for their predictive modeling. At the very least, the app developer breached Facebook’s terms of service by giving the data to Cambridge Analytica. After investigations began, the incident started a heated, nationwide conversation about the ethical principles of data, political targeting, and power. And about Facebook, data security, and cybersecurity.
Study Applied Statistics at Michigan Tech.
Election campaigning and increased microtargeting are very much still with us. Therefore, firms that generate value from personal data must consider the ways they acquire it, share it, protect it, and profit from it. Statisticians who work for these firms must also stay in line with ongoing legislative efforts that respect users’ privacy and security.
Curious about how statistics make a difference in elections? Are you fascinated by the data-driven side of political science? Do you want to ensure statistics are collected ethically? Alternatively, maybe you’re interested in developing the skills for collecting data and using applied statistics in business, government, finance, insurance companies, and more.
If you answered yes to these questions, Michigan Technological University’s Online MS in Applied Statistics offers students foundational knowledge in statistical science and methods while utilizing the latest industry-standard statistical and data analysis software. After graduation, you can set yourself apart in the competitive workforce with not only specialized skills, but also the accountability to act with integrity, honesty, and diligence.
And statistics jobs pay well, too. The U.S. Bureau of Labor Statistics (BLS) reported that, as of 2023, the median annual wage for a statistician was $104,860. Furthermore, the projected average growth rate through 2032 for jobs in these fields is 30%. That’s four times higher than the projection for all occupations in the same timeframe.
Upskill for the future with Michigan Tech’s Online MS in Applied Statistics.