By Karen S. Johnson
With close to 2,000 working satellites currently orbiting the Earth, and about a third of them engaged in observing and imaging o
ur planet,* the sheer volume of remote sensing imagery being collected and transmitted to the surface is astounding. Add to this images collected by drones, and the estimation grows quite possibly beyond the imagination.
How on earth are science and industry making sense of it all? All of this remote sensing imagery needs to be converted into tangible information so it can be utilized by government and industry to respond to disasters and address other questions of global importance.
In the old days, say around the 1970s, a simpler pixel-by-pixel approach was used to decipher satellite imagery data; a single pixel in those low resolution images contained just one or two buildings. Since then, increasingly higher resolution has become the norm and a single building may now occupy several pixels in an image.
A new approach was needed. Enter GEOBIA– Geographic Object-Based Image Analysis— a processing framework of machine-learning computer algorithms that automate much of the process of translating all that data into a map useful for, say, identifying damage to urban areas following an earthquake.
In use since the 1990s, GEOBIA is an object-based, machine-learning method that results in more accurate classification of remotely sensed images. The method’s algorithms group adjacent pixels that share similar, user-defined characteristics, such as color or shape, in a process called segmentation. It’s similar to what our eyes (and brains) do to make sense of what we’re seeing when we look at a large image or scene.
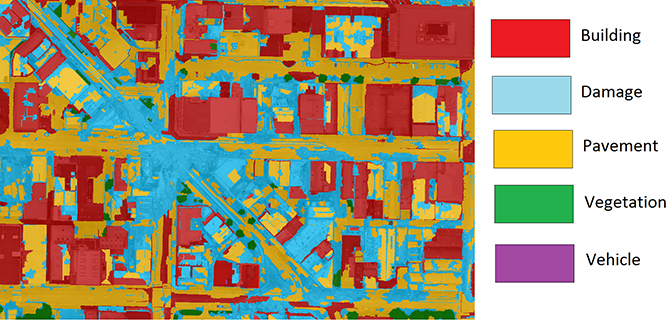
In turn, these segmented groups of pixels are investigated by additional algorithms that determine if the group of pixels is, say, a damaged building or an undamaged stretch of pavement, in a process known as classification.
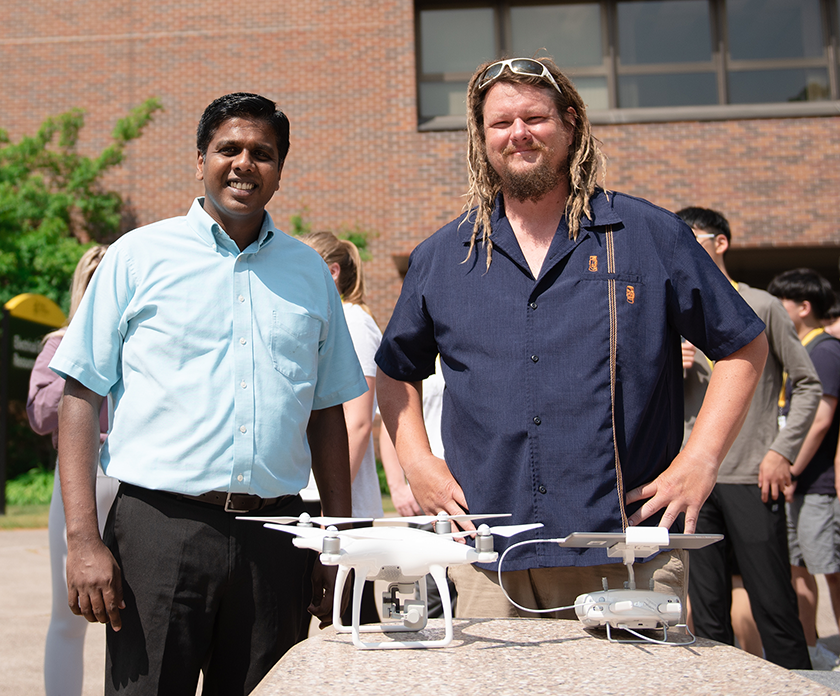
The refinement of GEOBIA methods have engaged geoscientists, data scientists, geographic information systems (GIS) professionals and others for several decades. Among them are Michigan Tech doctoral candidate James Bialas, along with his faculty advisors, Thomas Oommen(GMERS/DataS) and Timothy Havens (ECE/DataS). The interdisciplinary team’s successful research to improve the speed and accuracy of GEOBIA’s classification phase is the topic of the article “Optimal segmentation of high spatial resolution images for the classification of buildings using random forests” recently published in the International Journal of Applied Earth Observation and Geoinformation.
The team’s research started with aerial imagery of Christchurch, New Zealand, following the 2011 earthquake there.
“The specific question we looked at was, how do we translate the information we get from the crowd into labels that are coherent for an object-based image analysis?” Bialas said, adding that they specifically looked at the classification of city center buildings, which typically makes up about fifty percent of an image of any city center area.
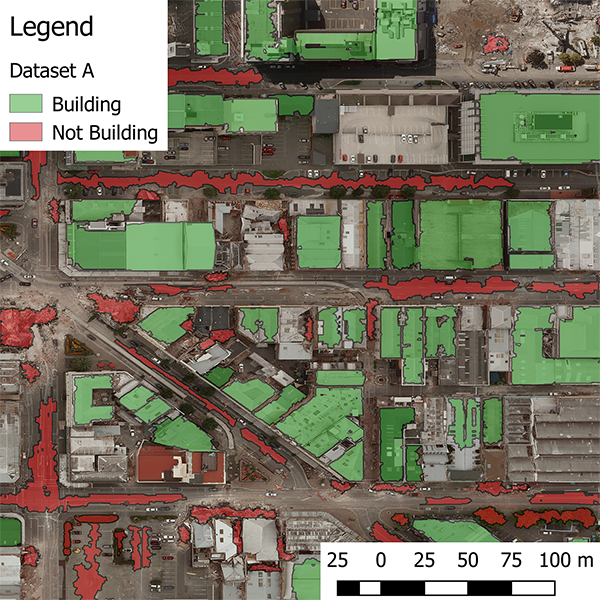
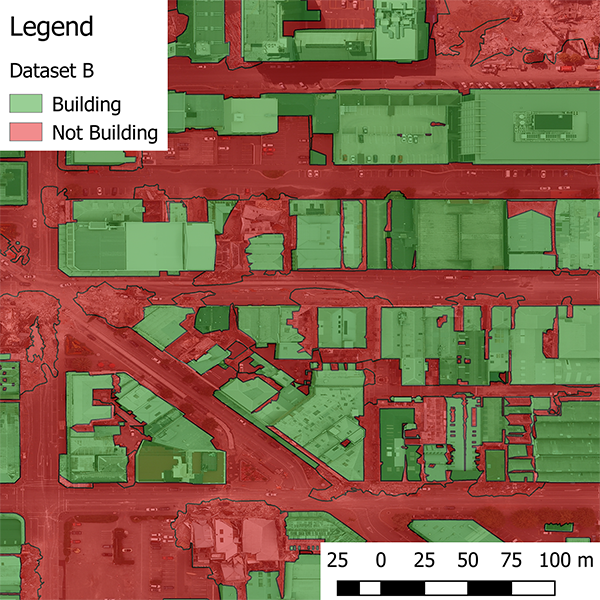
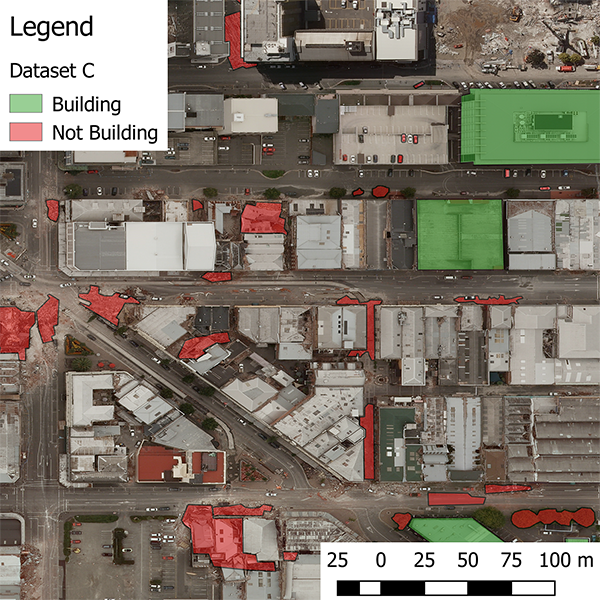
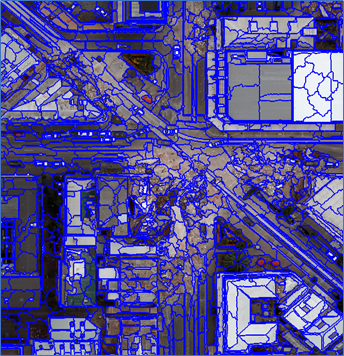
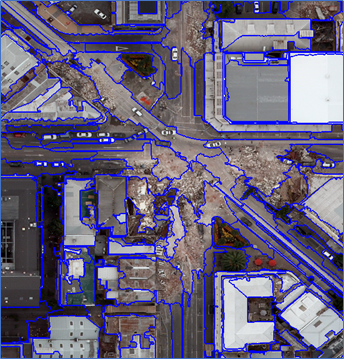
After independently hand-classifying three sets of the same image data with which to verify their results (see images below), Bialas and his team started looking at how the image segmentation size affects the accuracy of the results.
“At an extremely small segmentation level, you’ll see individual things on building roofs, like HVAC equipment and other small features, and these will each become a separate image segment,” Bialas explained, but as the image segmentation parameter expands, it begins to encompass whole buildings or even whole city blocks.
“The big finding of this research is that, completely independent of the labeled data sets we used, our classification results stayed consistent across the different image segmentation levels,” Bialas said. “And more importantly, within a fairly large range of segmentation values, there was pretty much no impact on results. In the past several decades a lot of work has done trying to figure out this optimum segmentation level of exactly how big to make the image objects.”
“This research is important because as the GEOBIA problem becomes bigger and bigger—there are companies that are looking to image the entire planet earth per day—a massive amount of data is being collected,” Bialas noted, and in the case of natural disasters where response time is critical, for example, “there may not be enough time to calculate the most perfect segmentation level, and you’ll just have to pick a segmentation level and hope it works.”
This research is part of a larger project that is investigating how crowdsourcing can improve the outcome of geographic object-based image analysis, and also how GEOBIA methods can be used to improve the crowdsourced classification of any project, not just earthquake damage, such as massive oil spills and airplane crashes.
One vital use of of crowdsourced remotely sensed imagery is creating maps for first responders and disaster relief organizations. This faster, more accurate GEOBIA processing method can result in more timely disaster relief.
*Union of Concerned Scientists (UCS) Satellite Database