CloudSat-based Assessment of GPM Microwave Imager Snowfall Observation Capabilities

Giulia Panegrossi, Jean-François Rysman, Daniele Casella, Anna Cinzia Marra, Paolo Sanò, and Mark S. Kulie published “CloudSat-based assessment of GPM Microwave Imager snowfall observation capabilities” in Remote Sensing on December 6, 2017.

doi:10.3390/rs9121263

The article describes a NASA Global Precipitation Measurement Microwave Imager (GMI) snowfall sensitivity study using CloudSat satellite radar data as evaluation dataset. The study illustrates complex high frequency microwave sensor signatures to snowfall events under different atmospheric conditions and microphysical composition. It defines environmental and snow-producing cloud composition thresholds where the 166 GHz GMI channel is sensitive to surface snowfall, thus providing useful guidance to improve GMI snowfall detection and estimation capabilities.

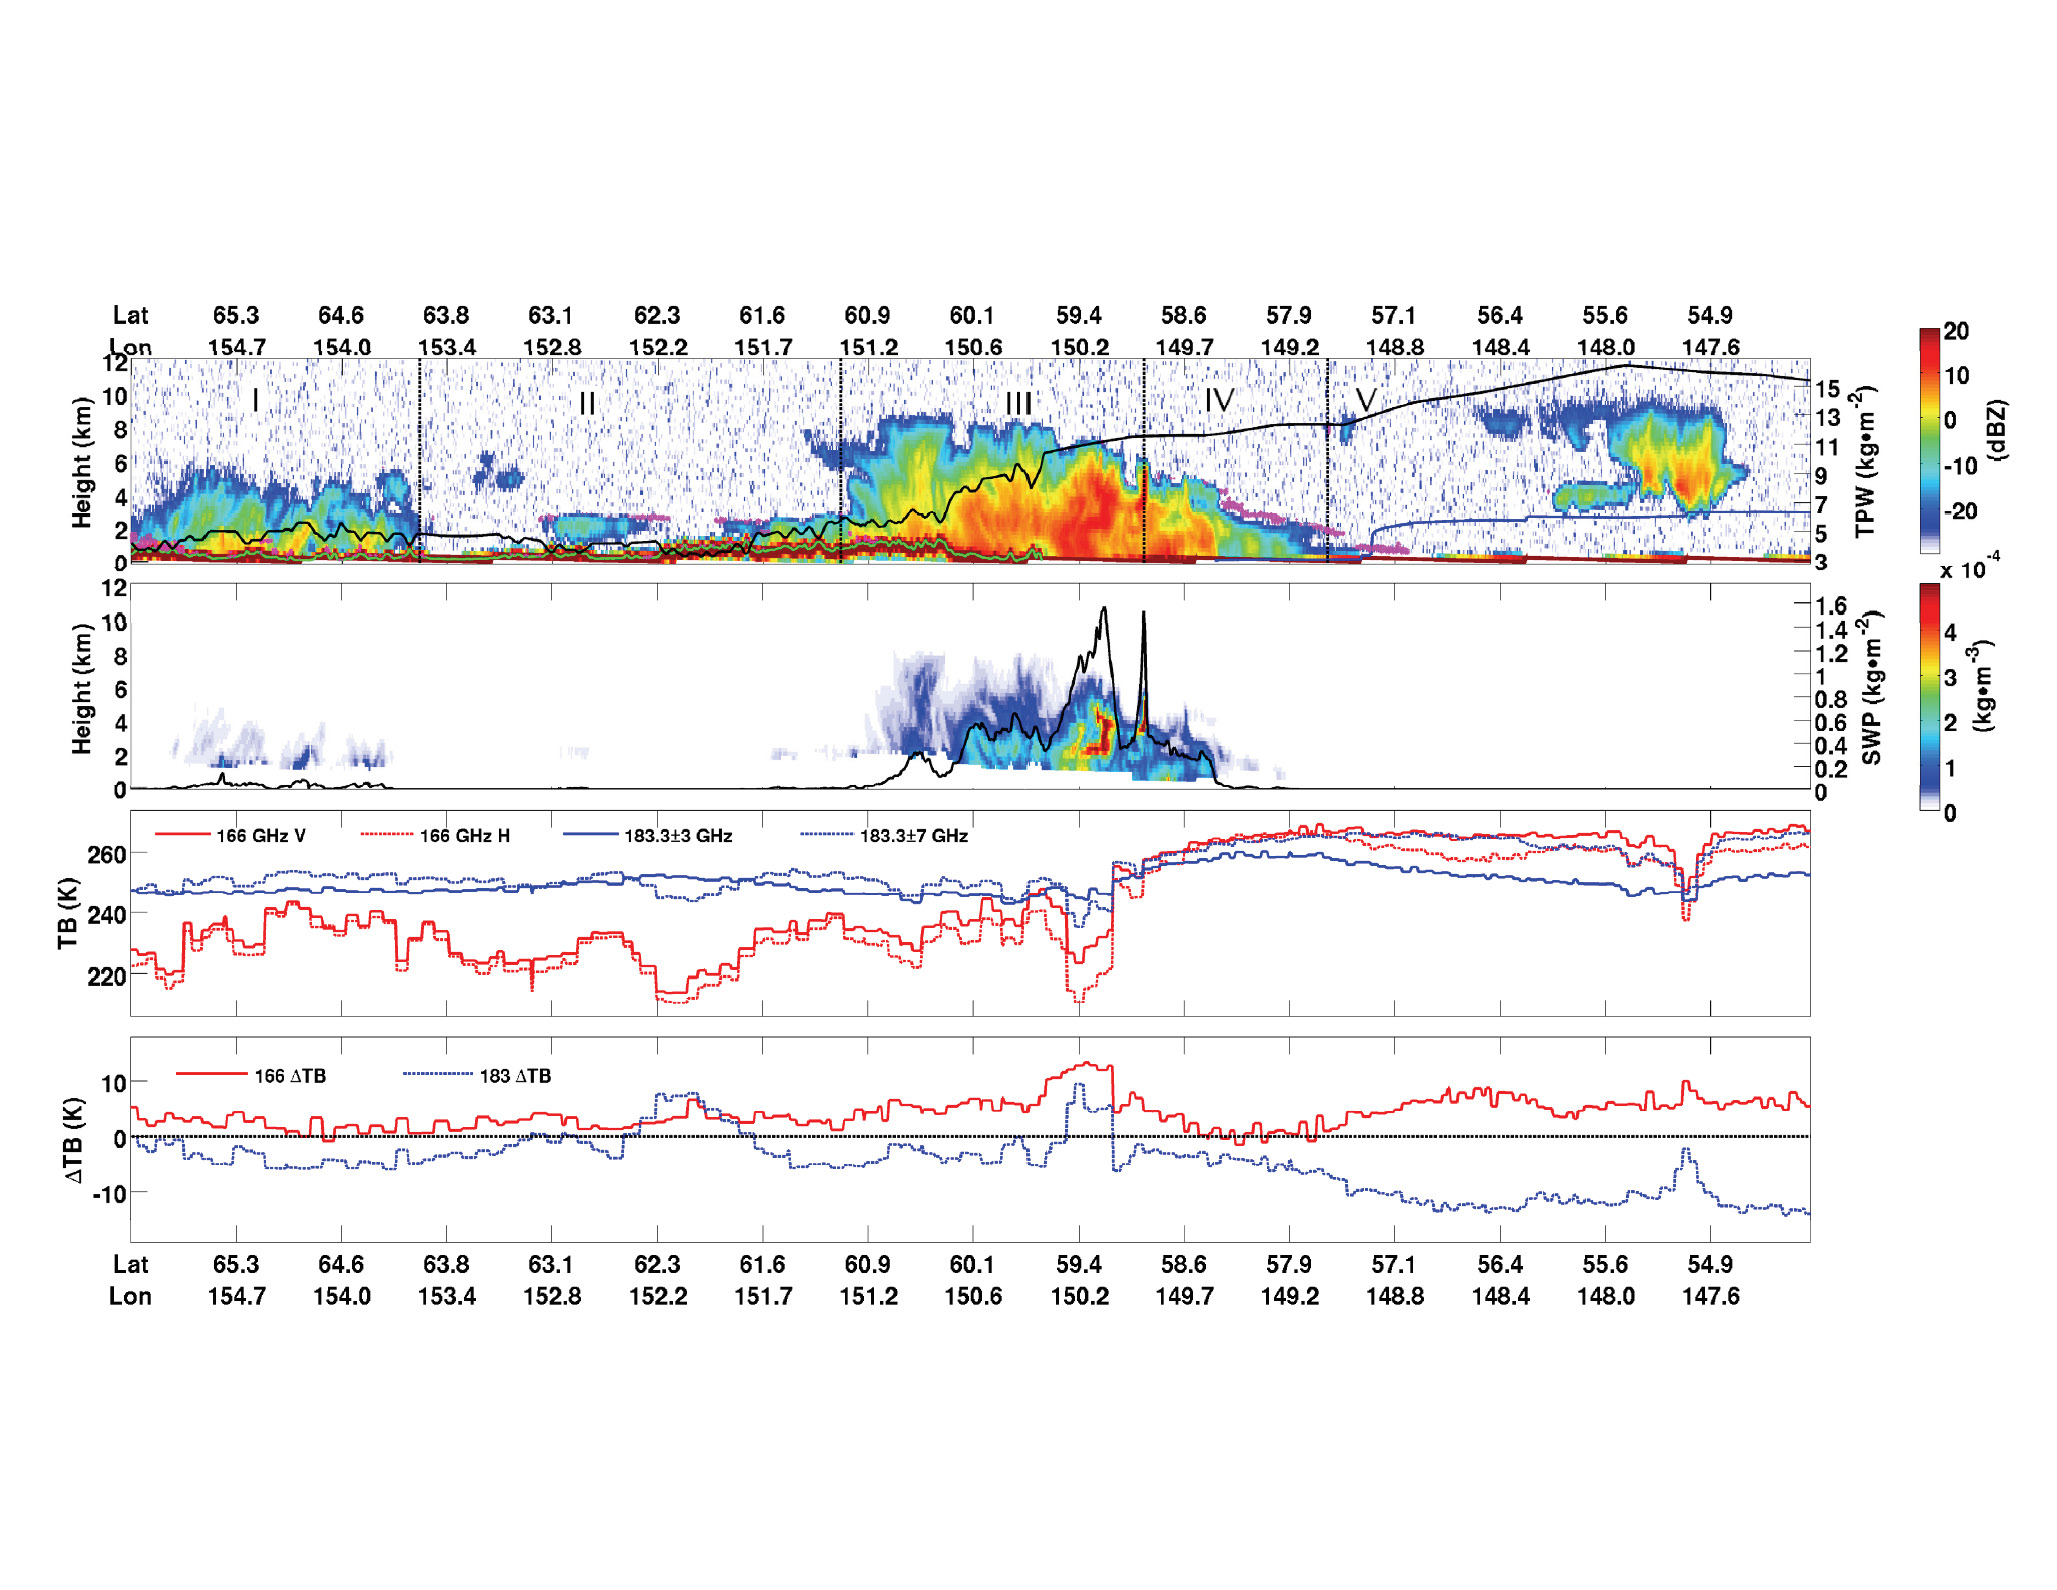
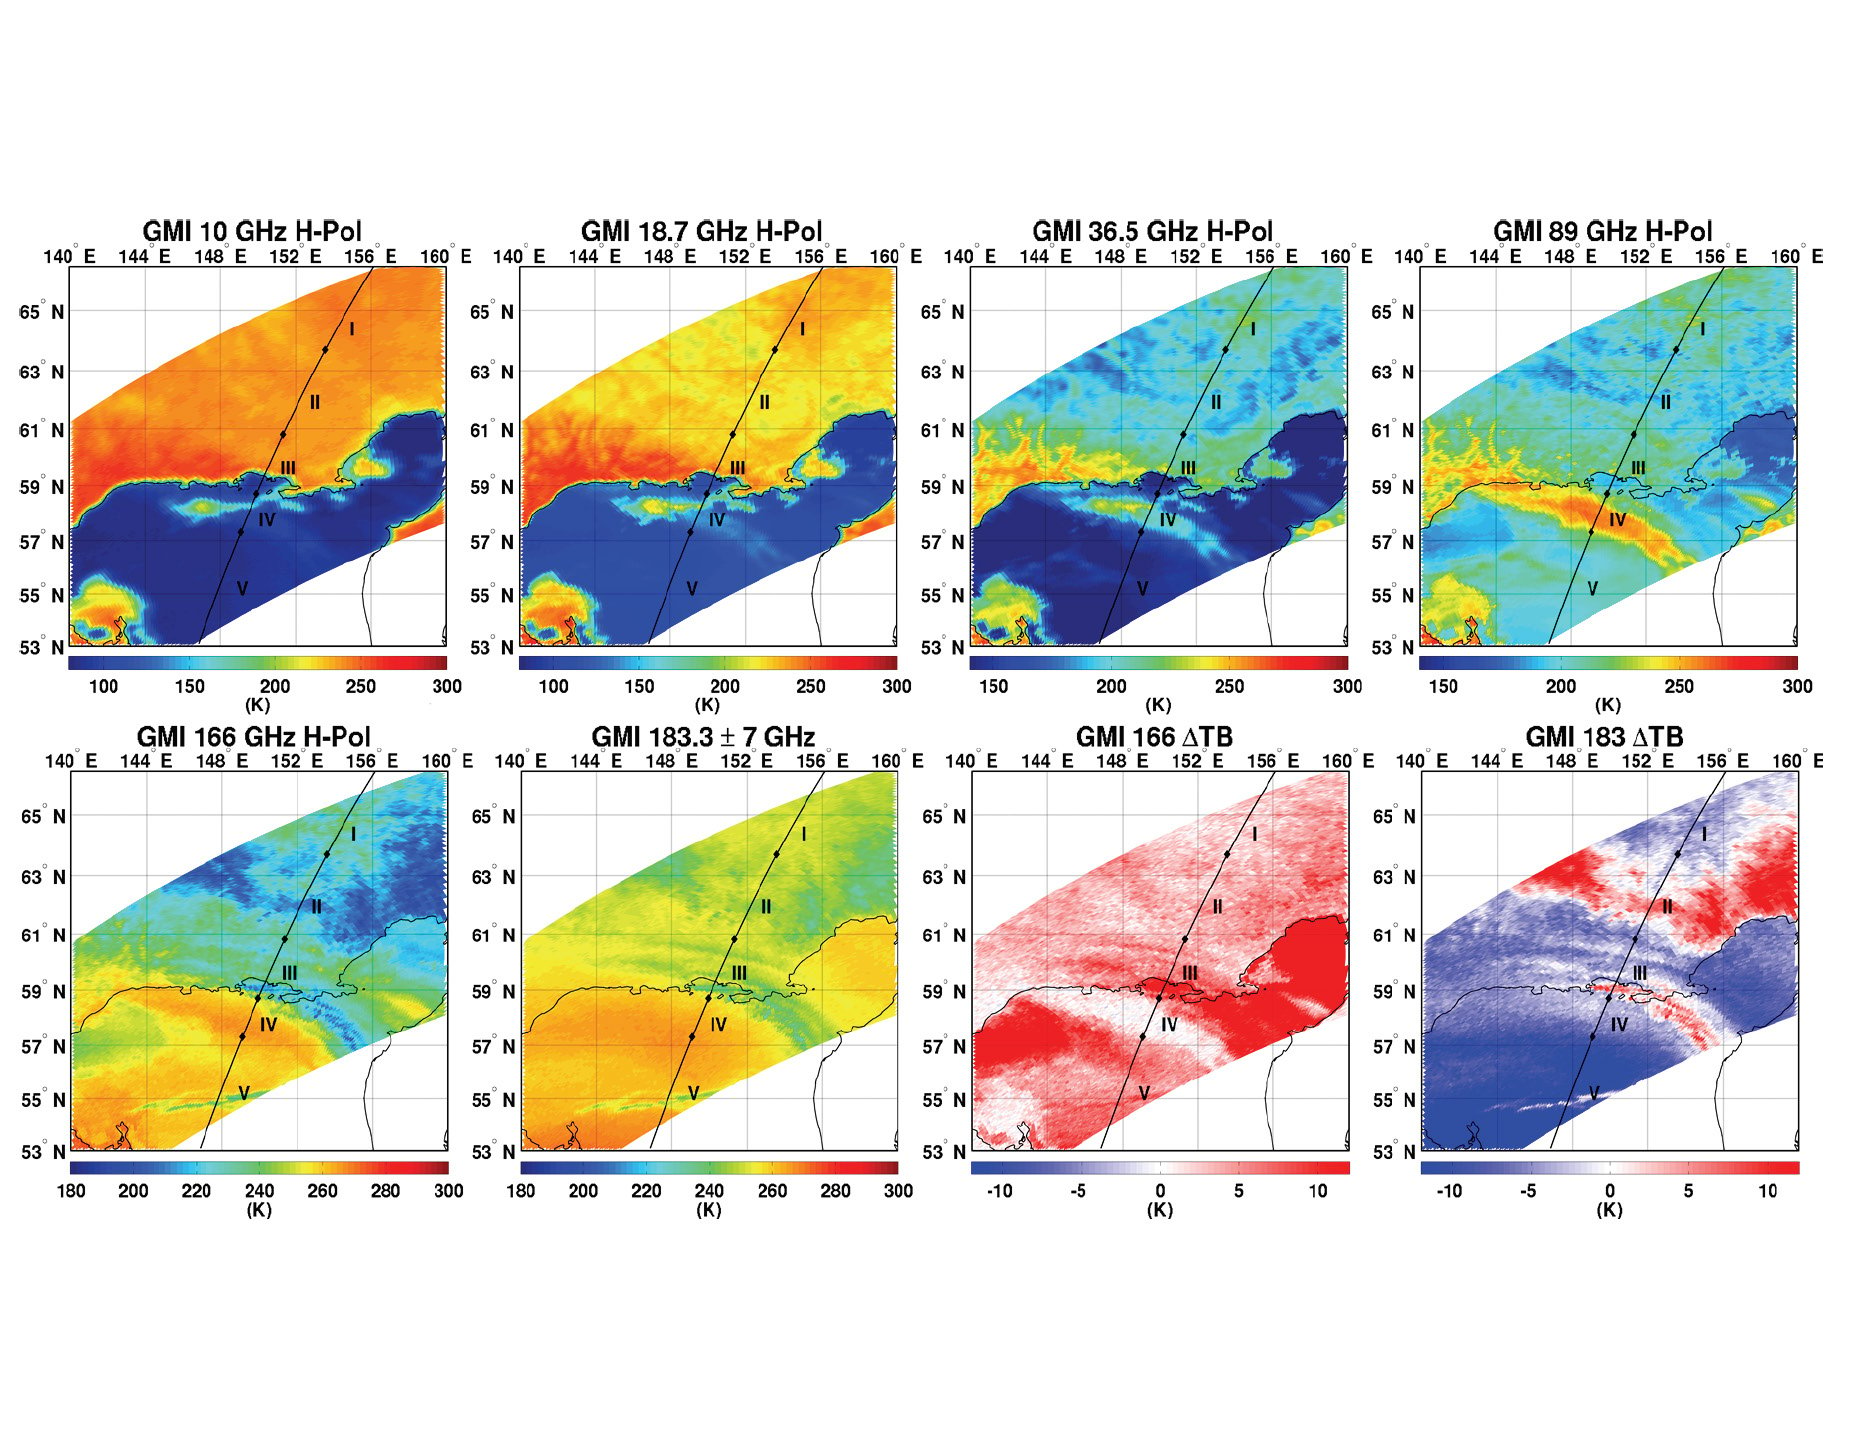
Figure 2. Snowfall event on 30 April 2014.

Graphs of height versus latitude and longitude for various quantities.
Fig. 2a. From top to bottom, the first panel shows height-lat/lon imagery of Cloud Profiling Radar (CPR) reflectivity (color bar, in dBZ), the freezing level height (blue curve), and total precipitable water (TPW) (black curve, with values provided on the right-hand side y-axis), along the CloudSat track. In this panel, cloud layers where the DARDAR product identifies supercooled droplets are superimposed and shown in magenta. Second panel shows height-lat/lon imagery of 2C-SNOW snow water content (SWC) (color bar, in kg·m−3) and the snow water path (SWP) (black curve, with values provided on right-hand side y-axis). The third panel shows the GMI brightness temperatures (TBs) closest to each CPR pixel along the CloudSat track at 166 GHz (V and H polarization, in red), 183.3 ± 3 GHz and 183.3 ± 7 GHz (in blue). Bottom panel shows GMI TB difference (∆TB) at 166 GHz (V-H, in red), and for the two 183.3 GHz channels (in blue). In the top panel, vertical lines delineate different Sectors (I to V) identified in the discussion (see text for details).
Color graphs of coordinate version temperature.
Fig. 2b. GMI TB imagery: top row from left, 10, 18.7, 36.5, and 89 (H-pol) channels; bottom row from left: 166 (H-pol) and 183.3 ± 7 channels, ∆TB at 166 GHz (V pol−H pol) and at 183.3 GHz (183.3 ± 3 GHz–183.3 ± 7 GHz). The black line segment in each panel shows the CloudSat track. The sectors (I to V) identified in the discussion are also indicated (see text for details).