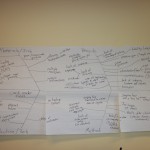
A recent kaizen event addressed a couple problems in residential dining: unauthorized access into the dining halls, and theft of food and utensils. One tool that we used to drive each day’s discussion was a Fishbone Diagram. After determining what was currently happening in contrast to an ideal state, a fishbone diagram was created to understand what problems stood in the way of reaching the future state.
The team brainstormed these problems and listed them on the diagram under headings (see picture below). The diagram aided in creating good discussion and exploration of the problem, the team members were able to piggy-back ideas that related to each other.
After the brainstorming cooled down and the team felt the diagram was complete, various techniques were used to prioritize the issues to see which ones will be tackled and in what priority. Common themes easily emerged showing where the team should focus their efforts. At the end of the kaizen event the team had a clear understanding of the problem, its causes, and where to go with countermeasures to improve the problems.

