Category: Success Stories

Quantifying the Value of Lean Improvements

We are pleased to present this guest blog post by Adam Wellstead, PhD, Associate Professor of Public Policy, Social Sciences at Michigan Technological University and 2019-2020 Faculty Fellow.

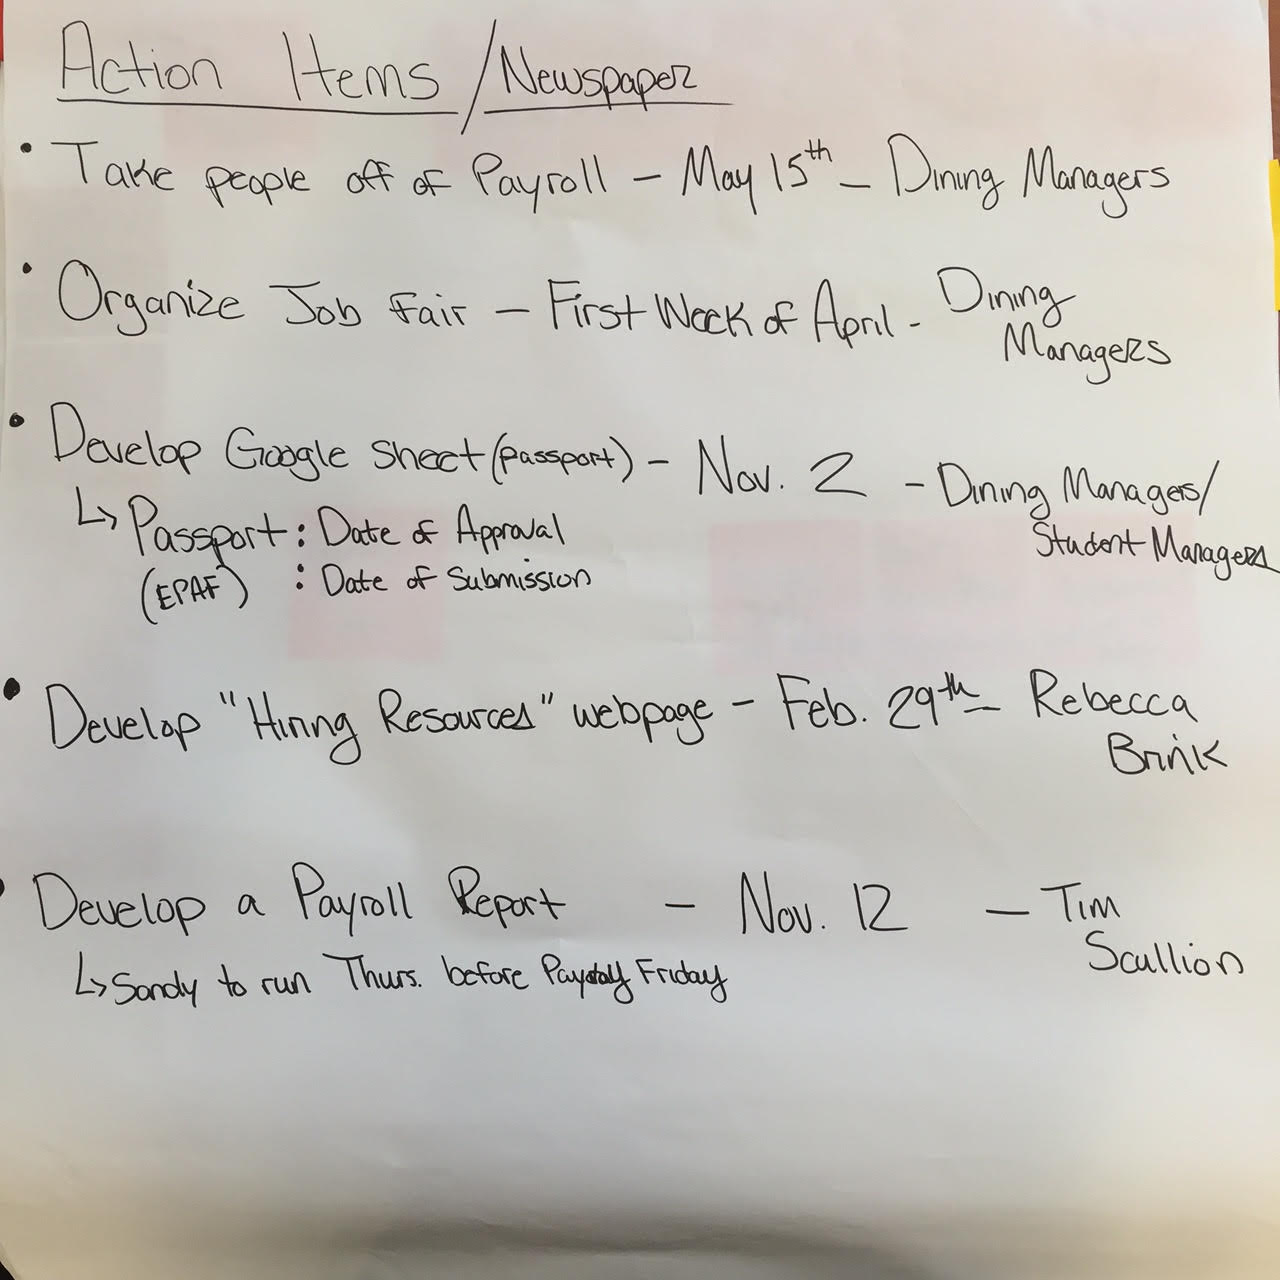
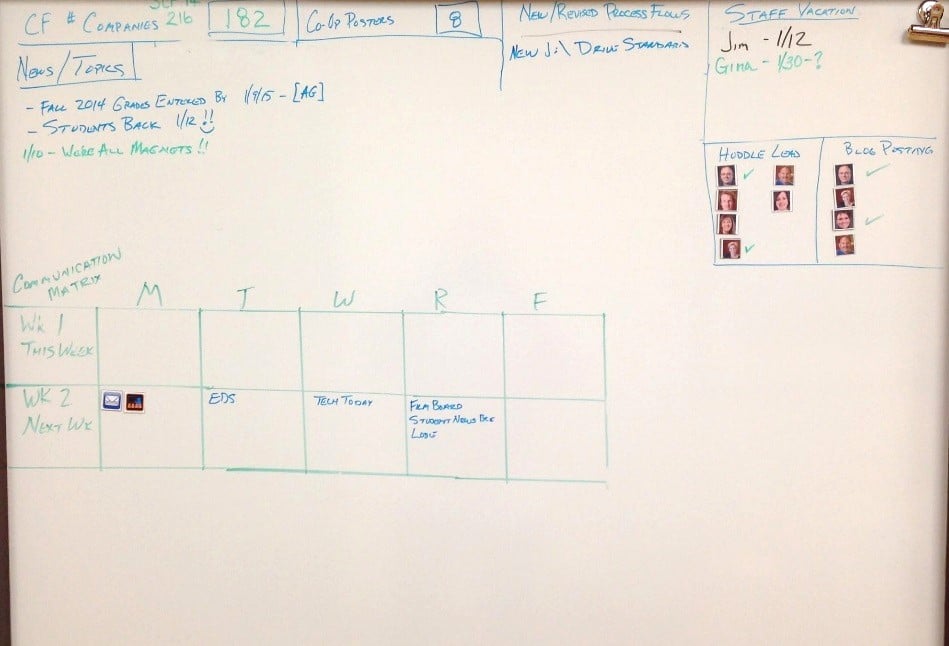
Every year, the Office of Continuous Improvement (OCI) undertakes a number of wide-ranging projects to make processes throughout our campus more efficient and effective. Often the project outcomes go unnoticed by a majority of the Michigan Tech community, including the bean counters. This contrasts with the manufacturing sector where Lean tools are applied to the creation of a tangible product, and costs/savings are meticulously tracked. Michigan Tech is a highly complex multiple million dollar business (of higher education), and OCI projects have improved safety and reduced waste. However, the accrued financial benefits are largely invisible because the current cost to the university for most of its processes is not documented. This year, I was a Faculty Fellow working with the OCI and one of my projects was to account for these costs.

Other universities who employ Lean methods and tools also struggle to show the financial benefits. One possible approach to account for these invisible benefits of Lean in a system that does not closely track expenses is to apply counterfactual thinking. This approach has played an important role in the efforts of social scientists, particularly historians, to assess causal hypotheses. By making claims about events that did not actually occur, counterfactuals play a necessary and fundamental, if often implicit and underdeveloped, role in the efforts to assess the hypotheses about the causes of a phenomena.

A well-known example is, had George W. Bush not been elected, would the Iraq war have occurred? Counterfactual analysis makes causal claims about events that did not actually occur; that is, non-observations. Social scientists have developed well-established criteria for judging counterfactual arguments (Table 1). For example, we cannot make implausible counterfactual claims. Looking at the Bush-Iraq War case, had George Bush not been elected, it is implausible to claim that Iraq would have been become a fully democratic country.

Table 1 Criteria Checklist for Judging Counterfactual Scenarios
Criteria Description
Clarity Specify and circumscribe the independent and dependent variables (the hypothesized antecedent and consequent)
Logical consistency Specify connecting principles that link the antecedent with the consequent and that are cotenable with each and with the antecedent
Historical consistency (minimal-rewrite rule) Specify antecedents that require altering as few “well-established” historical facts as possible
Theoretical consistency Articulate connecting principles that are as consistent with “well-established” historical facts as possible
Projectability Tease out testable implications of the connecting principles and determine whether those hypotheses are consistent with additional real-world observations

In the more modest world of Lean processes, we also can make a counterfactual causal claim about a non-observation, namely, what would have happened had the Lean process not been undertaken and what would have been the costs accrued by not addressing waste and inefficiencies? One recent OCI project highlights this approach. Daniel Heights has 52 buildings, all utilizing 1 of 13 different water heater pumps for circulating hot water to residents. This made it very hard to manage and keep records of the inventory for each pump type, brand, horsepower and orientation. Due to the amount of differentiation between the pumps, the process for reordering/replacing each pump lacked standardization and had many errors.

In 2019 standardization of pumps was implemented and an inventory of the pumps was taken. Now the shelves only contain needed pumps and are organized into a set space. Processes to perform inventory audits and reorder pumps are in place. The number of different brands of pumps being used for the water heaters in Daniel Heights went from 13 to two. They are also only using two different sizes of pumps when they were using five before. Table 2 lists the benefits that the project participants identified as well as the estimated yearly excessive costs of $8,461 had no action been taken (the counterfactual). The estimated value was determined by a deliberative process, keeping the criteria for judging counterfactual scenarios in mind, involving at least three OCI facilitators.

Table 2 Estimation of Excessive Costs Incurred by Michigan Tech
Area Improved from Standardization Excessive Costs
Water Use/Efficiency $100
Storage Space $286
Time to Reorder $375
$ Tied up in Inventory $4500
Hrs. Recording Inventory $270
Staff Training for Pumps $330
Bulk Inventory $2600
Total $ Saved $8,461
Table 3 Estimated Costs Incurred by Michigan Tech Over Five Years
Year Net Present Value
1 $8,058.10
2 $7,674.38
3 $7,308.93
4 $6,960.89
5 $6,629.41
Total $36,631.70

This is an example of one fairly modest project. In the coming months, the OCI will implement this procedure for all of its projects being undertaken.

Michigan Tech will be a very different place this Fall, but one constant will be the continual need to root out waste and inefficiencies, and thereby reduce costs.

Error Proofing

We are pleased to present this guest blog post by Heather Dunne, Digital Services Specialist for University Marketing and Communications at Michigan Technological University.

One of the common tools in Lean and continuous improvement is error proofing, or poka-yoke. Poka-yoke is a Japanese term that was developed and classified by Shigeo Shingo; that helps someone avoid (yokeru) mistakes (poka).

The concept is simple: Create countermeasures that guard against and prevent errors and mistakes from occurring in a process. If mistakes are avoided, the product quality is high, the customer is happy, and money is saved. Workers, engineers, and managers all must work together to write procedures and design devices to prevent errors from occurring at their source. Errors made within any process can lead to problems, including multiple wastes such as defects, overproduction, waiting, not utilizing people, transportation, inventory, motion, and excess processing.

Error proofing is implemented to prevent human error, but human error cannot be accepted as the cause of an error. The blame game does not apply. Humans make mistakes typically because there is a flaw in the process, itself. There are standard steps that can be taken when error proofing a process. First, take a first-hand look at the process, walking the gemba. Secondly, learn exactly where the error occurred. Then, conduct some problem solving analysis to uncover the root cause. Finally, develop countermeasures to prevent that error from happening again.

Some examples of real-world poka-yokes are the sensor in the gas nozzle that clicks when your tank is full, the ice maker in your freezer shutting off when the bucket if full, and your washing machine stopping when it is out of balance.

Michigan Tech’s Housing and Residential Life developed some poka-yokes for summer conferences:

  • A reference visual for staff who are setting up linens for a room.  It lists exactly what linens are needed and shows how they should be placed on the bed.  This saves staff time when gathering linens to distribute and reduces error in forgetting to place an item in the room.
  • Signage informing guests about areas they have access to and areas they do not. Limiting access to certain floors used the ERA principle–Eliminate Replacement Alternatives.  If the task that is creating the error is eliminated, then the error will disappear too.
  • A kanban board for management of the many groups that stay as guests. By arranging items, information, and people according to a sequence, they developed a good mistake proofing solution.

What are some ways you can apply this simple lean concept in your area?

A Bittersweet End

It has been an amazing 2 1/2 years for me in the Office of Continuous Improvement. Throughout my time as a Student Process Improvement Coordinator (PIC) I have had so many opportunities that I never would’ve imagined for myself as a college student. I can say, without a doubt, that  I would not be where I am now without the knowledge and experience that I’ve gained from this position. I can’t thank my co-workers, supervisors and peers enough for their support throughout the years.

I came into this position with very little knowledge of any specific Lean tools or methodologies, however, before this job I had mapped processes, organized work spaces, and analyzed root causes. So shortly after starting my training I realized that continuous improvement had always been a part of my life. When I came to this realization, I began feeling much more comfortable in my role, knowing that Lean wasn’t some revolutionary new idea; but simply a set of concepts that draw on a person’s natural tendency toward improving their quality of life. From there, it became very easy to understand and then apply those concepts to processes all over the university.

Since starting in January 2014, I have facilitated 3 Kaizens, acted as the team leader for 2 efforts, and have coordinated 22 improvement events across 12 departments on campus. I have thoroughly enjoyed the opportunities I’ve had to work with everyone from Dining Services to Human Resources to the Van Pelt and Opie Library and every department in between.

I will be starting my career with General Mills as a Global Sourcing Buyer and will look to carry my knowledge and experiences with Lean and continuous improvement and apply them in this new role. I will undoubtedly miss Michigan Tech and the Office of Continuous Improvement.

To everyone who has been apart of my journey…

THANK YOU!

Measuring Success

I recently facilitated a Kaizen project  for Dining Services that involved their student hiring process. A lot of good ideas and improvement plans came out of it, and the team was very excited about the opportunity to make this process more efficient. What stood out for me, however, was a new process step that we incorporated at the end of the Kaizen called “Measuring Success.”

As Lean practitioners we understand that metrics and data collection are pivotal to the success of any implementation initiative. However, sometimes we forget the benefits of putting these numbers on display for all to see; this group did not. We decided at the end of the day to put all of our success metrics with their respective goals and deadlines on a flip chart for each member of the team to display in their office. The motive behind this was to ensure that every day, with every decision they make, they are focused on reaching these goals.

I thought this was a fantastic idea and one that should be used in all of our projects in the future. A big part of Lean is engagement. Setting clear goals and expectations is a big factor in increasing employee engagement. When everyone is united and working toward a common goal, the opportunities for improvement are endless.

Measuring Success Flipchart


Newspaper Flipchart
Newspaper Flipchart


Lunch and Learn at the Lean Enterprise Institute

This summer I had the great fortune of being a mechanical engineering intern at Massachusetts Institute of Technology (MIT) Lincoln Laboratory. While in Cambridge, John O’Donnall, Executive Director of the Lean Enterprise Institute (LEI), was kind enough to reach out to me and invite me to visit the office. Mr. O’Donnall and I had the chance to meet on campus last year when he was the keynote speaker at the 2015 facilitator graduation.


Header
Lean Enterprise Institute located in Cambridge, Massachusetts


While there it just so happened that they were also having a guest speaker come in and talk about Lean in the civil engineering world and how much waste happens at construction sites because the main currency is the amount of time it takes to complete a project. Although I had to leave before the whole event was over I found her talk to be very interesting. It really opened my eyes to the need to integrate Lean practices into the civil engineering world the way mechanical engineering has integrated it into manufacturing. Below is a picture of the talk from an outside view.

Office_2
Presentation on integrating Lean principles into civil engineering projects


I also got to meet with James P. Womack the founder of the LEI, as well as some of the M.B.A. summer interns who were in the office. Every summer the office hired a few M.B.A. students from the area to work with them and learn in an immersive experience about Lean principles. John O’Donnell and I mused about the possibility of bringing in Michigan Tech M.B.A. students on as summer interns and I think that it could be a mutually beneficial experience for both parties. 


Elizabeth and John
Selfie with Mr. John O’Donnell


Before leaving John showed me around the office and I was pleasantly surprised with how much our own Office of Continuous Improvement here at Michigan Tech resembled the  Lean Enterprise Institute. A picture of their office can be seen below.


Office
Snapshot of the open floor plan office at Lean Enterprise Institute


I had a great experience there meeting up with Mr. O’Donnell, Mr. Womack, and meet some of their M.B.A. summer interns.  


Rozsa Rentals Improvement Event Part 1

Last week, The Rozsa Center for the Performing Arts held a kaizen event to improve their rental processes. The current process is inconsistent and very confusing for all parties involved including the client, rental staff, administration, production staff, Ticketing Services, and Catering. In order to see what the current state of the process is, the team decided to map out the process by way of a swim lanes process map. Before the team began creating the process map, Bob Hiltunen-Director of Auxiliary Services, provided some great process mapping guidelines that really helped the team. They are:

  1. There is no right or wrong way to map
  2. You don’t learn how to process map, you process map to learn
  3. Process map what is, not what you would like it to be

With these guidelines in mind the team was able to create a process map that included each department/area that the process touches and all of the process steps from start to finish (see image below).

Swim Lanes Map


With the initial map created the team was then able to move forward in creating an “ideal state” process map. The ideal state captures the process in a perfect world with all the necessary resources available. The team was able to look back at the current state map to compare steps and people involved with the ideal state map. The team will continue to work on their ideal state in the next few weeks and then form a plan to move from current to the ideal. Check back to see the final results in a future post.

Lean IT at Michigan Tech

This post was originally published in Michigan Tech’s IT News and Announcements blog. 

Lean principles are generally well established and have been applied to manufacturing for quite some time. The idea is simple: identify and eliminate areas of waste that lead to poor service for customers. Within Michigan Tech IT, we’ve begun to apply those principles to our work. Though the changes are small, they’ve made a large impact in how we do daily business, and they’re sparking a cultural change within our organization.

Group-ups

The Services Team is using daily Group-up meetings to increase awareness among staff and solve problems. “Our morning huddle brings everyone together for 15 minutes to discuss what is most important, most time-sensitive, and most technically problematic,” says David Kent, IT Services Director. One of the main objectives of the meetings is to help each other solve problems or help with time-sensitive commitments. “Threats to projects and deadlines are identified quickly, and often resolved on the spot, because the entire team is present,” says Kent.

DSCF2428

The morning huddle fosters a more efficient and open, collaborative attitude within the team. “Since we’ve started having the group-ups, our ticket count has decreased significantly, and we’re continuing to set record lows on a regular basis.  Everything that is important to our group is on the whiteboard for all to see, and each member is able to make updates as needed.  We definitely accomplish more with less because we focus on what is on the board.”

IMG_2029

Project Board (Cadence Board)

For the past month, the Enterprise Application Services group has been using a Cadence Board for their Web Focus Project. The low-tech and flexible visualization tool gives visibility to the current workflow and progress and informs the team of each other’s work progress. The board displays planned work, unplanned work, high level milestones, a parking lot (for future items) and a rolling two-week work plan. The team meets three times a week for status updates and discussion.

IMG_2048

“The board helps us keep the project moving and more easily keep track of its different elements,” says Emmett Golde, EAS Director. “It’s increased communication between team members, and because it’s so visual, you can immediately see who’s doing what and where they’re at in a particular process. Tasks are shown in small enough pieces so that we can see where the workload is distributed. It shows us if a particular team member is overloaded.”

Process Mapping for a Kaizen Event

When Ashley Sudderth, Chief Information Compliance Officer, met with the Office of Continuous Improvement on March 23, it was to discuss IT’s Procurement and Deployment process for new machines. “It was an area that generated a lot of help desk tickets and was one we knew needed improvement,” said Ashley. “We met with the Office and completed a process map of the P&D process. They helped us examine the process for where we could benefit from a Kaizen event… and we chose the service desk workflow for task management.”

Through the mapping process other small changes were identified that had a big impact in addition to the Kaizen event. “It’s been very helpful to have outside input from actual customers who also understand the Lean Process,” said Angie Hebert, Sr. Help Desk Consultant, a member of the process mapping team. “One of the things customers were unsure of was what software would be included on their machines at delivery. We took that feedback and set up a web page that gives them a full list of what software they will receive as a standard installation. It was just one of the things that we might not have considered had we not gone through this process.”

One of the deliverables: a new computer checklist which now accompanies each new deployment.
One of the deliverables produced as a result of process mapping: a computer checklist which now accompanies each new deployment.

Though the team is still in the process mapping stage, they’ve already seen major benefits. “Our team members have an increased knowledge of the parts and pieces in the deployment process from procurement to the actual builds,” says Hebert. “We’ve seen more care and diligence in work, resulting in faster, better builds in deployment.”

Josh Olson, Chief Technology Officer, is embracing the shift to Lean IT. “As an organization, we want to be open to change in our processes and methods and commit to continuous and ongoing improvement,” he says. “Since we’ve started incorporating Lean thinking into our daily work, we’ve seen measurable improvement. The culture is changing. We’re changing. Lean IT is improving the way we provide services to our customers.”

Lean Thinking in an Office

A warm welcome to our new guest blogger, Jim Desrochers. Jim is the Associate Director for Employer Relations in Michigan Tech’s Career Services. He is also training to become a campus Lean Facilitator.

In a manufacturing setting, waste is measured in terms of factory efficiency and scored by the accounting measurement system as part of the financial reporting process. In an office setting, these measurements are harder to define but they “show up” in wasted effort, frustration, frayed nerves, and people staying late to help make the event a success.

Our Career Services group is known for coordinating our bi-annual Career Fairs. Managing logistics for hundreds of companies, nearly a thousand recruiters, and several thousand students leaves very little room for error.  Most importantly, the future careers of our students are on the line. With the economy improving and the excellent reputation of Michigan Tech students, the size and expectations for Career Services events have continued to grow.

Career Services Huddle Board

As our department’s first step in our lean journey, we decided to start a morning huddle.  Initially, the primary focus of the meeting was our event-planning calendar. This grid is a look ahead for the next few weeks to ensure everyone in the department knows what is coming next. To make this happen, we repurposed a dry erase board and moved it to a central area. A few dry-erase markers later, we had the beginnings of a communication structure!

In an office where everyone is extremely busy, we had reservations about everyone sacrificing 10 minutes of their day. We also were concerned that we would not know what to talk about! These concerns turned out to be unfounded! After a month of using this new process, the information on the dry erase board has changed. Some things we initially placed on the board aren’t used anymore and we simply erased them. New items are added as we develop new educational programming. Using only markers and bad penmanship, the board continues to be dynamic. We are starting to use rulers and magnets to make the look neater – but we don’t want to lose the flexibility of just getting the information communicated.

Our implementation of Lean Initiatives in our offices continues as time allows. As we continue to add process improvements, these items will find their way back to the central huddle board. It will be interesting to see what the board looks like a year from now!


Network Drive 5S Best Practices

Most people practicing Lean know 5S–Sort, Set, Shine, Standardize and Sustain–and they know it can be applied to many things. Here at Michigan Tech we have applied this thinking to shared network storage spaces. I have now facilitated 4 of these events.

At the first one I facilitated, I obediently followed what I was taught and started with Sort. We went through all the files and worked on deleting the garbage. For Set, we worked on putting the remaining files into a logical order and making things easier to find.  Shine involved going back through the files (again) and renaming them consistently. When we came to the Standardize step it basically turned into documenting what we had spent a lot of time doing–what should be kept, for how long, where to store things, and naming conventions. Finally, the Sustain phase, including setting up regular audit schedules and procedures for making sure the drive stayed neat and organized.

In the end we did leave with a well-organized, easier to navigate shared drive, but the process itself was frustrating and extremely long. The team spent an inordinate amount of time during the Sort and Set phases strongly “discussing” whether a specific file should be kept or deleted and what folder it should be in. We also did think of metrics, kind of. We looked at the overall size of the share and, in the end, did make it smaller. But if you are only measuring the size of the share and your goal is to minimize it, then the simple answer to achieve perfection of that measurement is to just delete everything and use zero GB, right?

Around that time, I read an article, “5S Shakeup” by John Casey on the Quality Progress website, and had a revelation–perhaps we should be starting with the 4th S instead. On my next network drive 5S event I was able to try this out. We started by creating the standards document. I began this discussion off with one simple question–what is the purpose of this drive? We talked in general about what should be kept at all, how long to keep files, and how to name them. This completely focused the whole event and eliminated the extended discussions on specific items. The Sort, Set, and Shine could all be done in one pass through because the rules were already defined, and these steps were split up and done as homework instead of in a big group. The individuals returned to the next meeting with just a few files they were uncertain about, and the group made decisions on their disposition together.

I also worked on the metrics. At the pre-meeting with the team leader, we dug more into why they wanted to attack this problem. This helped to identify various metrics that would actually measure what they needed them to. If the why was because new staff can’t find things easily, we did several before and after time tests to see how long it took to find various files.  If the problem involved just too much stuff, we still looked at the overall size, keeping in mind that zero is not really the goal, but more like reduce and then maintain that reduced size. We looked at the number of root folders, total number of folders and total number of files.

This event went much smoother, and I heard a lot of comments from the team members that they really enjoyed the experience.  When another campus facilitator was slated to do one of these events she asked me for some tips as she knew I had done a few, so that prompted me to write some Best Practices, which I have made available here: Network Drive 5S Best Practices January 2014.

Lean Principles and Tools in Industry: Part 2

Thank you to our returning guest blogger Mary Fogelsinger-Huss for another excellent article on how Lean is used in industry. Mary is an ASQ Certified Six Sigma Black Belt working for the Dow Corning Corporation in Midland Michigan. She has nearly 30 years experience in the chemical industry, with nearly half that time involved in quality practices for various product lines in the company. She holds a bachelors in Chemical Engineering from Michigan Technological University.

Many Lean devotees are very familiar with the idea of 5S and the benefits an orderly work space provides.  Not only does the 5S tool make the work better, it provides a much less stressful working environment.  To take that thought to another level, the work process itself needs to be studied. A very powerful tool in identifying waste in a process is the Process Map. There are many types of maps that can provide insight into the workings of a process. One of the maps used frequently in a Lean activity is the Spaghetti Diagram. It’s called this because if it’s done correctly, your drawing will look like a plate of tangled up spaghetti! This tool helps you understand the route the product, or operator, takes through the process. The idea is to trace the route over a period of time, to actually see the movement. The map is typically done with paper and pencil, and follows the movement through the physical space, so they’re usually quite messy!  They are also very revealing.  This example is in a test lab:

spaghetti diagram

The different lines represent the number of trips a person took in performing a test.  The background is the layout of the lab, with the test equipment noted by numbers (or dots in this poor image). This shows that the operator performing the test walks back and forth quite a bit between the different pieces of equipment.  Depending on your goal, this could be good or bad…good for exercise, bad for productivity!

The project team recognized the “waste of motion” in the process, using the spaghetti diagram, and was able to move equipment around to minimize the trips from one bench to the other throughout this test. This change allowed the test to be completed in less time, improving customer relations (production buildings want to know results FAST!) and increasing testers’ productivity.  A simple tool, providing impressive results.