Thank you to our returning guest blogger Mary Fogelsinger-Huss for another excellent article on how Lean is used in industry. Mary is an ASQ Certified Six Sigma Black Belt working for the Dow Corning Corporation in Midland Michigan. She has nearly 30 years experience in the chemical industry, with nearly half that time involved in quality practices for various product lines in the company. She holds a bachelors in Chemical Engineering from Michigan Technological University.
Many Lean devotees are very familiar with the idea of 5S and the benefits an orderly work space provides. Not only does the 5S tool make the work better, it provides a much less stressful working environment. To take that thought to another level, the work process itself needs to be studied. A very powerful tool in identifying waste in a process is the Process Map. There are many types of maps that can provide insight into the workings of a process. One of the maps used frequently in a Lean activity is the Spaghetti Diagram. It’s called this because if it’s done correctly, your drawing will look like a plate of tangled up spaghetti! This tool helps you understand the route the product, or operator, takes through the process. The idea is to trace the route over a period of time, to actually see the movement. The map is typically done with paper and pencil, and follows the movement through the physical space, so they’re usually quite messy! They are also very revealing. This example is in a test lab:
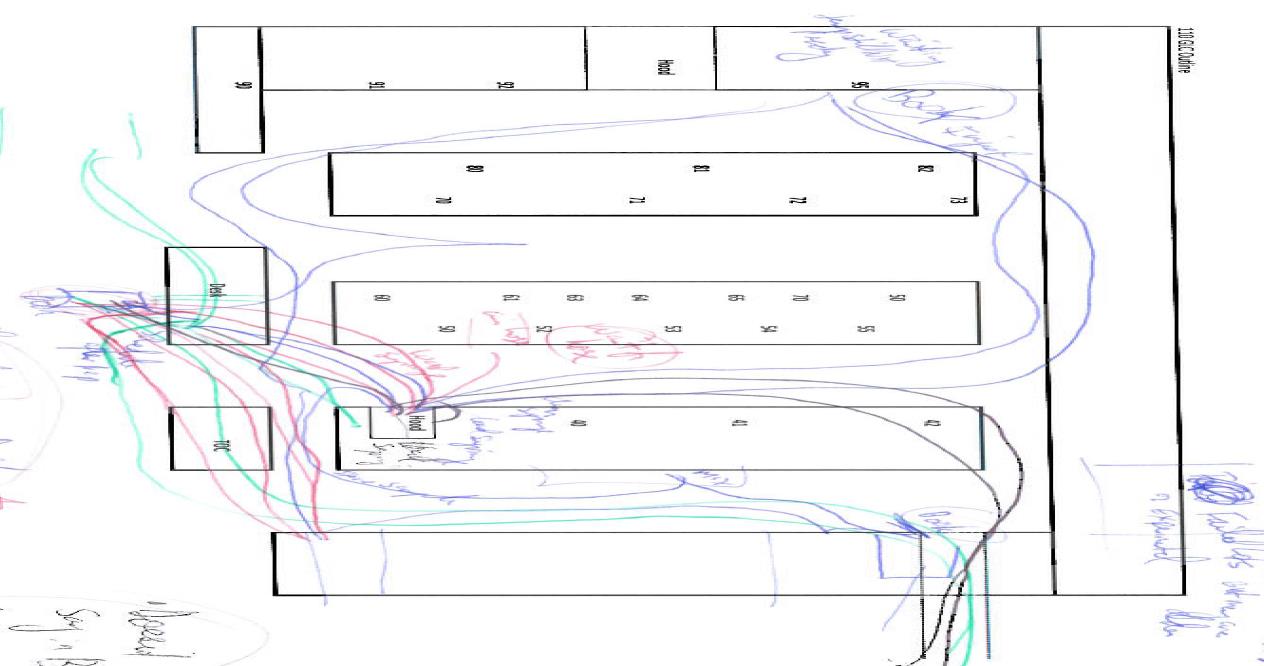
The different lines represent the number of trips a person took in performing a test. The background is the layout of the lab, with the test equipment noted by numbers (or dots in this poor image). This shows that the operator performing the test walks back and forth quite a bit between the different pieces of equipment. Depending on your goal, this could be good or bad…good for exercise, bad for productivity!
The project team recognized the “waste of motion” in the process, using the spaghetti diagram, and was able to move equipment around to minimize the trips from one bench to the other throughout this test. This change allowed the test to be completed in less time, improving customer relations (production buildings want to know results FAST!) and increasing testers’ productivity. A simple tool, providing impressive results.