
A very happy midsummer to all from the northern reaches of Michigan! This is the season for long days in the Keweenaw, and I thought it would be fun this week to explore some of the basic mathematical facts about sunrise, sunset, and the length of days, and throw in a little signal processing to boot.
First off, while the days are long this time of year, what makes them seem longer here is the timing of sunrise and sunset. Yes, we are pretty far north compared to most of the 48 contiguous states, but we are not really that far north. At 47 degrees N latitude, we are at about the same latitude as the northern tip of Maine, we are slightly south of Seattle, south of most of Canada and all of Alaska, and well south of all of Great Britain and Scandinavia. Our longest days in the summer are about 16 hours, and the shortest days in the winter are about 8 hours. There are plenty of places on the globe with greater variation in the length of day than that. The reason we think the days are so long right now is because of a quirk in the time zone map. Like all but three counties in the Upper Peninsula, Houghton County is in the Eastern time zone, despite the fact that we are slight west of Chicago, which is in the Central time zone. The story goes that we are on Eastern time so that we would be in the same time zone as the bankers and mine owners on the East Coast, 100 years ago. As a result, this time of year the sunset occurs around 9:50pm, and twilight extends for another hour or so after that. For those of us working at Tech and leaving around 4 or 5pm, it’s like another whole day to play outside.
This year the summer solstice occurred on Wednesday, June 21. While we often think of the solstice as a day, in fact it is a particular moment in time when the Earth’s axis of rotation is most tilted toward the Sun. At that instant, the axis of rotation is co-planar with the axis of revolution of the Earth around the Sun, and the Sun shines directly down on the Tropic of Cancer. This year the solstice occurred at 12:24am EDT, on Wednesday, July 21. The time of the summer solstice moves forward about 6 hours, or one quarter of a day, each year, as the period of revolution of the Earth around the Sun is about 365-1/4 days. The 1/4 day is why we have a leap year ever four years, and on those years the time of the summer solstice moves back 18 hours from the previous year. Oddly enough, part of the reason we say the solstice occurred on June 21 this year has to do with Daylight Saving Time; if we were on Standard Time the solstice would have occurred on Tuesday, June 20, at 11:24pm. As it turns out the longest day of the year, measured from sunrise to sunset, was actually June 20.
Here is a little-known fact which has fascinated me ever since I discovered it. The longest day of the year does not coincide with either the earliest sunrise or the latest sunset. At our latitude, the earliest sunrise occurs about 5 days before the solstice, and the latest sunset occurs about 5 days after. That means that, at the time of this writing, we have not even seen the latest sunset this year; that will occur on Sunday, July 25, at 9:54:06 p.m. The sunset time is not changing quickly, though: on both June 24 and June 26, sunset is at 9:54:05 p.m. Those who understand the basic concept from Calculus 101, that the slope of a function is zero at its maximum, will appreciate that.
The length of the day is defined as the time between sunrise and sunset, or if we want to do an arithmetic calculation, it is the sunset time minus the sunrise time. The addition or subtraction of two periodic functions that are synchronized in time is an important concept from the course I teach, EE1110, Essential Mathematics for Electrical Engineering. There we consider a particular class of functions, called sinusoids, and show that as long as two sinusoids have exactly the same frequency, then the sum or difference will also be a sinusoid, and furthermore there is a straightforward algorithm to figure out where the peaks and valleys of the sum (or difference) will be relative to the peaks and valleys of the signals being added or subtracted. In the case of the sunrise and sunset times, we already see that the earliest sunrise and the latest sunset are offset by about 10 days at our latitude, and that the longest day will occur somewhere in the middle.
Thinking there might be an interesting connection between electrical engineering and astronomy, I figured I would just go ahead and look at the numerical data in MATLAB and see if I could use it to illustrate EE1110 principles. There are lots of places on the Internet to find sunrise and sunset data times; here is one operated by the U.S. Navy: http://aa.usno.navy.mil/data/docs/RS_OneYear.php. What is nice about this site is that it provides the data for an entire year, in a format that is easy to cut and paste into an Excel spreadsheet. So, that is exactly what I did: I put the 2017 data into Excel, then imported it into MATLAB, then reformatted it so that times are expressed in minutes (from midnight) and kept everything in Eastern Standard Time. I also got rid of the months and dates, simply numbering the days sequentially starting with Day 0 being January 1, 2017. All of that took longer than it should have, but now I have the data conveniently in a .mat file.
The upper panel in Figure 1 below shows the time of the sunrise (in green) and sunset (in red), measured in minutes from midnight, Eastern Standard Time, as a function of the day, for the entire year 2017. In the lower panel I show the length of the day (in blue), in minutes, which is simply the sunset function minus the sunrise function. For point of reference, one full day is 1440 minutes.
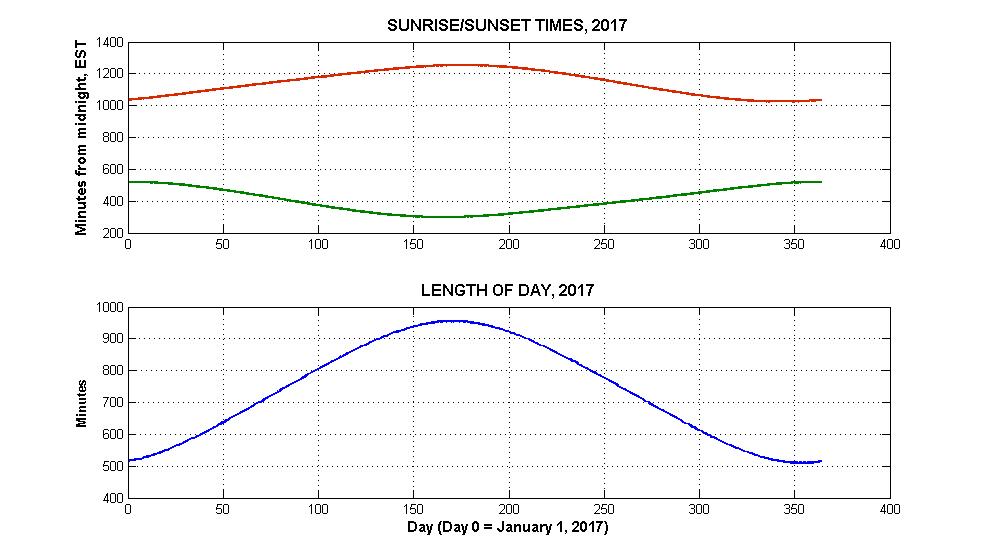
Here is where I got the first of three surprises in this little exercise. The sunrise and sunset functions are quite asymmetric, in the sense that they do not look the same when you flip them upside down. The latest sunset occurs after the summer solstice, whereas the earliest sunset occurs before the winter solstice, which means that the time from a peak to valley is considerably shorter, like 20 days, then the time from a valley to a peak. We see the same behavior in the sunrise data. Now the symmetry of sinusoids is important to a lot of the EE1110 theory, and because of the asymmetry issue we cannot use sinusoids to model sunrise and sunset data. Consequently, the idea of using sunrise and sunset times as an illustrative example of EE1110 concepts is out the window. Dang!
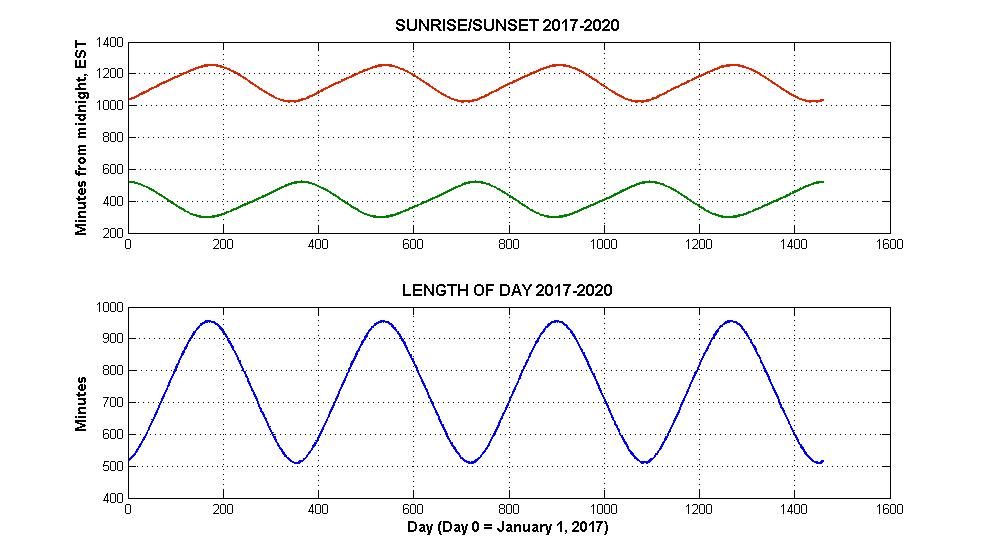
We are not done yet, however. As can be observed in the lower panel, the length of day function does exhibit symmetry, in fact it looks downright sinusoidal. So, I thought maybe we could throw some of our signal processing tools (well beyond the scope of EE1110) at this data and see if we can determine the period, or time for one complete cycle. To make this a little more accurate, I decided to look at four consecutive year’s worth of data, from 2017 to 2020. This data is shown in the Figure 2 below, which is essentially the same as Figure 1 except it goes for four years. To compute the period, or more precisely the frequency (the inverse of the period, in cycles per day), I used a common technique from signal processing of computing the Discrete Fourier Transform (DFT) of the data, using an algorithm called the Fast Fourier Transform (FFT), and looking for the point at which the DFT reaches its maximum. For those following along at this point, I subtracted off the mean of the data, and zero-padded it out to 65536 data points before computing the DFT. Doing these kinds of calculations in MATLAB comes very easily to me after many years of signal processing research; it’s the kind of stuff I can sit at my desk and bang away and have it work right the first time.
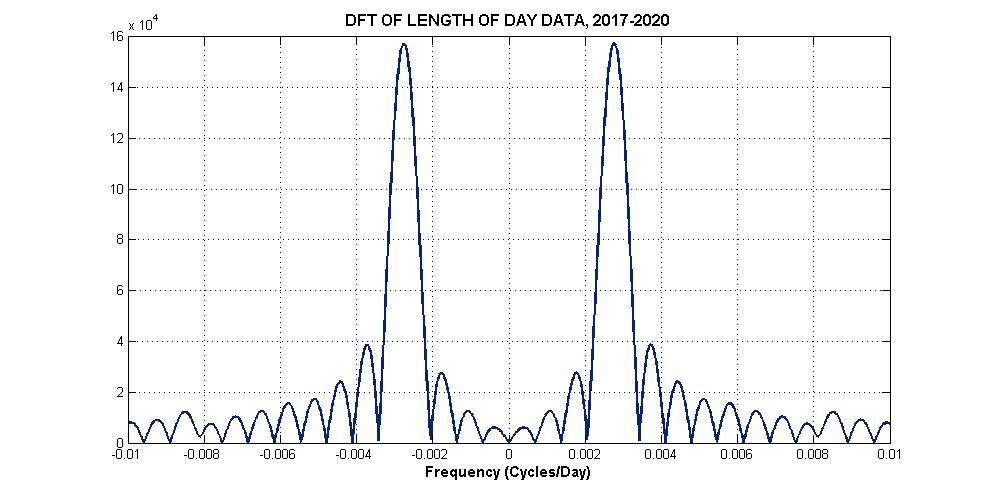
Except…I made a crucial mistake, and got the second surprise. The absolute value of the DFT of the length-of-day data is shown in Figure 3 below. The horizontal axis has units of frequency, in cycles/day. I was able to zoom in and find the frequency at which the DFT reaches a peak, and that value is 0.002762 cycles/day. 1 over this should be the correct period for one revolution, right? Wrong. 1/0.002762 = 362.06 days. I knew that can’t possibly be right – the period should 365.25 days. Where did I go wrong? It turns out I fell into a common trap (that I often rail against) of using the DFT without thinking carefully about the interpretation of the results. I had “known” forever that the best way to determine the frequency of a single sinusoid is to the compute the Fourier Transform and look for a maximum. That result is part of the collective wisdom of everyone in signal processing, and goes back at least to the often cited paper by D. Rife and R. Boorstyn, “Single Tone Parameter Estimation from Discrete-Time Observations,” IEEE Trans. Information Theory, September 1974. Well, I went back to that paper and found my error. Rife and Boorstyn consider the frequency estimation for a function called a complex exponential, sometimes called a complex sinusoid. (EE1110 students know all about complex exponentials, right?) For complex exponentials, computing the Fourier Transform and looking for a peak is exactly the right thing to do. However, a real sinusoid, like our length-of-day data, is actually the sum of two complex exponentials, one at a positive frequency and one at a negative frequency. The Fourier Transforms of those two complex exponentials can interfere with one another in such a way that the peaks can be shifted from what we would consider the correct location, in this case some 3.2 days (or the equivalent error in frequency). After some reflection I realized that the only way to really get the frequency right – that I could think of, anyway – is to do what is called nonlinear least-squares estimation, which essentially means looking exhaustively across all sinusoids for one that comes closest to matching the given data. Without going into too much more detail, I did exactly that for my length-of-day data and came up with a frequency of 0.002738 cycles/day, which corresponds to the period I expected, 365.25 days.
Last observation, and last surprise. I mentioned above that, before taking the Discrete Fourier Transform, I subtracted off the mean value. Out of curiosity, I went back and looked at that mean value; it was 734 minutes, or 12 hours and 14 minutes. Hold on, I thought – how can the average length of day be anything other than 12 hours? Every spot on the Earth enjoys equal amounts of light and darkness over one entire year, so the average has to be 12 hours, right? Again, wrong. Thanks goodness for the Internet. I Googled “average day length greater than 12 hours?” and hit on this beautiful little explanation: http://rickbradford.co.uk/DayLength.pdf. The author identifies three separate effects, but the largest and easiest to explain has to do with the non-zero diameter of the disk of the Sun, as seen from the Earth. We define sunrise and sunset as the moments when the Sun just appears or disappears over the horizon, but in fact it might be more accurate to define it as the moment when the center of the Sun disk crosses the horizon. That would bring more symmetry to the definitions of day and night, and shave a few minutes off the time we associate with day. Because of the nonzero diameter of the Sun, more than 50% of the Earth can see at least a portion of the Sun at any given moment, thus making the average length of day greater than 12 hours.
Make the most of these long days and the beautiful weather! The days are already getting shorter.
– Dan
Daniel R. Fuhrmann
Dave House Professor and Chair
Department of Electrical and Computer Engineering
Michigan Technological University