Tag: Sustainability assessment

Life Cycle Assessment and Sustainability

This is a guest post from Dante Paglia, who is a fourth year computer science undergraduate at Michigan Tech. He can be reached at dfpaglia@mtu.edu


Life cycle assessment, also known as life cycle analysis, is used to assess environmental impacts associated with all stages of a product’s life. The stages include the collection of the raw materials, processing those materials, manufacturing the product, distribution via various transportation techniques, use of the product as well as the repair, disposal and recycling during the products end of life. This kind of assessment is used by companies and product designers to better understand their products impacts, discover where the product can be improved, and work toward implementing those improvements. Below is a visual of the stages of a products life that are looked at during a life cycle analysis.


The National Institute of Standards and Technology (NIST) [Public domain] image of Life Cycle Thinking, Wikimedia Commons
Photo from: https://commons.wikimedia.org/wiki/File:Life_Cycle_Thinking_Product_System.jpg


There are four main phases of a life cycle analysis. The first phase is the goal and scope. This sets the outline of the study and depicts the format of the results as well as who will receive the results of the assessment. The second stage is the life cycle inventory. In this stage the inventory flow of inputs for a product are recorded. Examples of inventory flows include, water, energy, raw materials and waste releases to either land, air or water. In this step, all of the inputs and outputs that are used or created during the products life are recorded. The third stage of a life cycle assessment is the actual impact assessment. The data gathered in the previous step is sorted and assigned impact categories to help weigh the impact the product has on the environment. Lastly, interpretation is done. The information from the results of the analysis must be checked and evaluated. In other words, the results of phases two and three are summarized in the interpretation phase. The completed assessment is then reviewed to understand the impacts of the product and to see where improvements can be made to lessen the overall impact on the environment.

Life cycle analyses are a widely popular tool to increase a company’s sustainability. This is because the analysis usually includes information that fits into all three pillars of sustainability. While the overall goal of the assessment is to review environmental impacts, social and economic impacts are considered as well. You can learn more about the three pillars of sustainability by clicking here.

There are many variants of a life cycle assessment where different stages of a products life are analyzed. The three most common kinds are cradle to gate, cradle to grave, and cradle to cradle. Cradle to gate only looks at a product when it is in the hands of the producer, once it leaves the factory its impacts are no longer considered. Cradle to grave takes it a step further and follows a product from the very beginning all the way until it is disposed of. Lastly, cradle to cradle takes things even further and instead of disposal of the product, it is recycled and reused in the process again. Often a cradle to cradle design leads to the least amount of environmental impact. One example of cradle to cradle is discarded asphalt pavement being reused to create new pavement. Below is a graphic showing another example of cradle to cradle design with steel production. This shows how everything, including the waste bi-products of steel production can be used for something useful or simply recycled back into the steel making process.


Life Cycle Assessment – What is it?

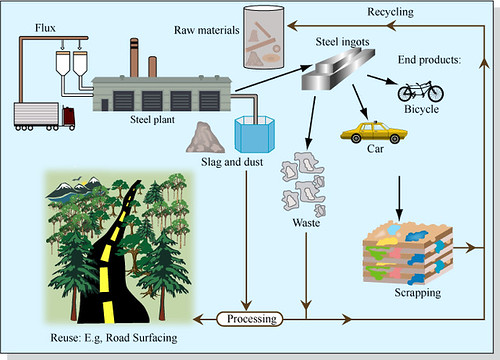
Photo from: https://www.flickr.com/photos/mitopencourseware/3247853726


An example of the use of life cycle analysis is the U.S. Department of Energy produced report that shows the energy and environmental benefits of LED lights over incandescent and fluorescent lights. LED lights proved to be more energy efficient and less harmful to the environment to produce as well as transport than both other kinds. This led to a rise in popularity of LED lights hence providing an overall benefit of large energy savings and significantly less environmental harm. The full study can be found by following this link.

Additionally, life cycle assessment is something that many solar panel producing companies are required to do and have planned out prior to receiving funding from the government. Since solar panels include hazardous materials like cadmium and cadmium compounds, it is not only important to make sure that the raw resources are being retrieved in a safe manner but the end of life of the products needs to be taken into account. If a solar panel is to be disposed of for any reason, whether it be because it broke during production or it is no longer being used or is being replaced, companies need to make sure that their product with these hazardous chemicals is properly disposed of. This means it cannot be tossed into landfills but needs to be recycled in a manner where the harmful compounds are disposed of properly or reused for new solar panels. This article on solar panel recycling explains some of the options there are for safe disposal of unwanted or old panels.  A life cycle assessment helps find issues in these stages and brings them to the attention of the product’s producers allowing them to change their ways.

Life cycle assessment is an important concept to be aware of because every company should be doing some variant of a life cycle analysis for their products. Not every company needs to do cradle to cradle analysis, but they should assess their production in some way. By doing so they can discover issues in their production cycle as well as make improvements to make their product better in terms of energy and environmental harm. With this, their product and company as a whole will become more sustainable and attractive to the large number of investors and customers who are paying closer and closer attention to companies sustainability policies. Most importantly in modern day, the end of life portion of production needs to be analyzed and understood so companies can mitigate the environmental impact their product does. The more recycling options that can be found for products the better to reduce the amounts ending up in landfills causing more harm with their pollution than good they provided overall. Without these kinds of analysis, companies would be able to do whatever is the most cost effective in production, which almost never coincides with sustainability and being environmentally friendly.


Whose pollution is it?

Now that it is summer, I finally have some time to write about papers published this year that have been quite interesting. I’ll start here first with one published by Lin et al. in PNAS back in February that sought to calculate how much of the air pollution that wafts over to the US from China can be attributed to the stuff we buy from them…. that is, the pollution that is produced through the production of plastic do-dads and other things that we import and consume here. The authors looked at sulfur dioxide (a precursor to acid rain), nitrogen oxides (potent greenhouse gases), carbon monoxide, and black carbon (also implicated in climate change).

In total, they found that “about 21% of export-related Chinese emissions were attributed to China-to-US export”, indicating that one-fifth of their air pollution is driven by our consumption of their goods.

As for the pollution that wafts over to the US, Chinese pollution was sufficient to cause at least one additional day of ozone levels that violated US standards from Los Angeles to the eastern seaboard. In particular, a substantial proportion of sulfate pollution measured in the western US was attributable to Chinese exports.

Quite a few years ago, my colleagues and I wrote about the way that international trade can complicate consumption impacts on the environment…. specifically how the international wood trade can hide the link between wood consumption and deforestation. One of the consequences of our increasingly international economies is our growing blindness to how we impact our environment (which is now global as well). Prior to the Industrial Revolution, production and consumption were mainly local to regional; product availability was closely tied to regional weather, soil, and human labor. Prices could reflect these conditions and overall supply, including how that supply impacted the quantity and quality of resources such as water, air and soil. Now that our economy has globalized, we need to find better ways to allow product data and prices to once again reflect the environmental capacity of the system, so that we can better understand the impacts of our consumption. Lin et al.’s paper nicely illustrates why we should care about pollution in China; our environments are as connected as our economies, and negative environmental impacts elsewhere have a way of “boomeranging” back to us.

Ironic hypocrisy

For all of the teaching and research I do on sustainability…. living it, measuring it, valuing it…. I am occasionally a very poor example of it. In the past couple of weeks I have traveled to Scotland, Argentina, and Washington D.C.; ironically, those last two trips were meetings focused on the sustainability of carbon-neutral biofuels. Although I am very anxious about calculating my carbon footprint over these three trips (since I’d probably have to stop breathing for five years to get back to something close to carbon neutral), I am going to do it here as a form of very public shaming. I am hoping that it will motivate me to insist on more virtual trips…

Using this calculator, my total carbon footprint for the flights for these three trips was:

Houghton –> Scotland (measuring sustainable landscapes workshop) –> Houghton: 1.18 metric tons.

Houghton –> Argentina (Pan-American sustainable biofuels workshop) –> Houghton: 1.81 metric tons.

Houghton –> Washington, D.C. (NSF Sustainable Energy Pathways meeting) –> Houghton: 0.31 metric tons.

Total: 3.30 metric tons.

That’s roughly the same amount of carbon that a person in the Maldives emits PER YEAR. It would take roughly a hectare of forest a year to sequester the carbon from those three trips.

Yikes.

Keeping up with the Jones’

In this week’s Proceedings of the National Academy of Sciences, Easterlin et al. have published a study on changes in “life satisfaction” (a.k.a. happiness) in Chinese villages during their economic transition over the past several decades. One might predict that as the Chinese have increased their incomes, they would become happier.

But as this study and a growing body of research demonstrates, money really can’t buy happiness. Prior to the conversion of a state economy to something resembling a market economy, Chinese life satisfaction was highest. As the country began its economic transition in the mid-1990’s, life satisfaction declined, possibly due to the increased level of uncertainty in many people’s lives. After 2000-2005 life satisfaction began to increase, but only for those in the upper income brackets. Even for those in the highest income brackets, life satisfaction has not yet approached what it was before the transition.

Over the transition, China had moved from one of the most egalitarian societies in terms of wealth distribution to one of the least. Although it is possible that the poor were left even poorer by the transition (or at least their economic stability declined), the results suggest that it is relative wealth that creates a decrease in life satisfaction. When you are surrounded by individuals as poor as you, the poverty doesn’t sting quite as bad. This phenomenon has been found often in past studies, suggesting that we humans can be a ferociously jealous lot.

This study (and others like it) has two implications for sustainability.

1. For a majority of people, “life satisfaction” is at the top of their list of characteristics of a sustainable life, right up there with adequate food and water, shelter and clothing, family and friends. Therefore, if researchers in sustainability science can figure out a way to accurately measure this characteristic, they can then use it to measure the current sustainability of a community, region, or nation, and help inform policies, programs and activities that might help a community move towards sustainability by increasing their general life satisfaction. For a long time, per capita Gross Domestic Product (GDP) was used as a proxy for this characteristic, but now a measure of income or wealth inequality called the Gini index has also been added to better capture this notion of happiness, mainly due to studies like Easterlin et al.’s.

2. Since excess consumption in luxury items (i.e., those things we want but don’t need) is one of the main drivers of resource depletion, studies like this one reinforce the lesson that happiness (and therefore sustainability) is unlikely to reside in things but rather in community and one’s place in it. The applied side of sustainability efforts often focus on replacing luxury consumption with activity and community work (e.g., volunteering, local governance, etc.). Indeed it was not long ago when this idea was prevalent in America; Victory Gardens (and war rations), the Peace Corps, and other activities that emphasized community contributions over consumption received popular support. Many of these new sustainability movements (e.g., Transition Towns, the Slow Movement) are actually repurposed efforts from previous eras to increase the life satisfaction component of our lives.

Walking is so pedestrian

This recent article in Slate on the amount of walking that Americans do relative to those in other countries could not have been more timely for me (and thanks to Grist.com for bringing it to my attention!). I read it while in Newport, Rhode Island at a professional meeting (the US-International Association for Landscape Ecology, of all things) and it really struck a chord.

Always the cheapskate, I found a hotel that was almost one-third of the price of the hotel where the meeting was held, and it was only about a mile away: an easily walkable distance. I like to build these sorts of walks into my day, especially when I’m at a conference that involves a lot of sitting in dark rooms for hours on end. The morning walk ensures that I am awake for the presentations, and the evening walk allows me to reflect back on what I’ve learned.

However, although the walk looked straightforward and perfectly safe on the web, it was considerably less so in reality. At least a third of it involved walking in a grassy/sandy ditch while cars sped past on a two-lane road (and I was not the only walker using this route), and the rest of the way included narrow sidewalks littered with street signs, fire hydrants, and other impediments (I suppose I should include dog poop here as well). Marked and posted pedestrian crossings across two busy county roads were few and far between.

It seemed odd to me that a tourist-based town was so difficult for pedestrians, especially given that the town was settled far before automobiles were invented (some of the old houses in the historic district dated back to the 1700’s). Most likely, the space once devoted to pedestrians and horse-drawn carriages was given over to automobiles, with not much thought given to their inherent incompatibilities. Walkability is often emphasized in conversations regarding sustainable cities, and now I have a very personal understanding of this issue.

The Trick-or-Treating Index

This was a really interesting article on the Grist website last week that I saved for this Very Special Day. The author discusses two recent rankings of cities as related to their “trick-or-treat-ability”: the opportunity for small children to walk from house to house in a neighborhood safely. I thought they sounded quite suspiciously like several “sustainable communities” indices, but they are a festive twist on this sustainability assessment staple.

Zillow developed the rankings using four proxies for trick-or-treat-ability: Home value index (more ritsy homes mean safer neighborhoods and better candy); Walkability (so kids don’t have to be driven door-to-door by parents…. although this has something to do with laziness as well, I suspect); Density (the more doors closer together, the less walking needed to fill up the bag); and Violent and Nonviolent Crime rate (for obvious reasons). San Francisco, Boston, Honolulu, Seattle, and Chicago top this list.

Richard Florida also gives it a shot, including in his index the percentage of kids under 14, median household income, share of adults who walk to work, density, and percentage of “artists, designers, and other cultural creatives” (read: those people not likely to buy a boring costume at a discount retailer…. a group which may have little overlap with people who have kids. But I digress.) His index ranks Bridgeport-Stamford, Los Angeles, New York, Chicago and Washington, D.C. as the best trick-or-treating spots.

Of course, trick-or-treating is probably just as safe and productive (from a kid’s point of view) in the smaller, rural towns of 10,000 – 30,000, where everyone knows each other and older houses form closely-knit neighborhoods around a central downtown core. The house prices may not be high in these areas, and perhaps the neighbors hand out the fun size bars instead of the real deal, but these towns certainly shouldn’t be excluded altogether from this sort of index.

And yes, Houghton MI is a pretty decent place to collect a pillowcase full of candy on Halloween.