This snippet is used to embed charts on your page from Google Sheets. You can select from various chart types and include a chart title and axis titles. For accessibility compliance, Google includes a table that is read/visible only to assistive technology. For this reason, you must use specific formatting or layouts in your data sheet.
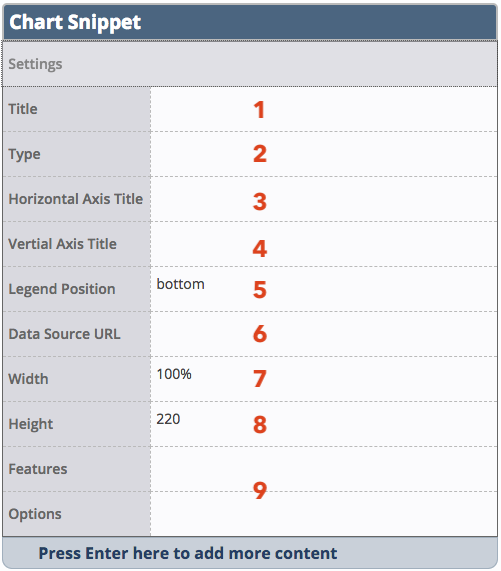
- Enter the chart title in the Title field if desired. This will display above the chart in bold font. If you do not include a chart title, you must have a heading on the page immediately before this snippet.
- In the Type field, select the name of the type of chart you want to display. Enter the name of the type of chart you want to display.
- In an asset, you need to type in the appropriate Type: AreaChart, BarChart, ColumnChart, LineChart, or PieChart.
- Enter the title for the horizontal (x) axis in the Horizontal Axis Title field if desired.
- Enter the title for the vertical (y) axis in the Vertical Axis Title field if desired.
- Legend Position will determine where the legend will display in relation to the chart. Leave it as bottom or change it to right or none.
- In the Data Source URL field enter the URL for the data source.
- The sheet must have headings across the top of row 1 and the data in the cells below that. You cannot include any other information in other cells of the sheet other than the data for the chart.
- The data cells of the sheet must be formatted to Number or other appropriate setting, not Automatic.
- Publish the Sheet to the web.
- Under File, go to Share, and select Publish to web.
- Leave all the defaults and under the Published content & settings section make sure that “Restrict access to the following” is not checked.
- Click Publish.
- Make sure the Sheet Sharing settings are also set to “Anyone with the link.”
- Change the URL to be like
https://docs.google.com/a/mtu.edu/spreadsheets/d/yoursheet/gviz/tq?gid=yourgid- where yoursheet is the ID for your spreadsheet, normally after /d/and before /edit?ts= in the URL of the live sheet (it’s usually a long string of random letters and numbers)
- and yourgid is the gid for the tab within the sheet as found in the URL of the live sheet.
- The /a/mtu.edu part of the URL should only be used if it is in the live URL of your sheet.
- You may need to include &headers=-1 at the end of the URL for certain chart types, such as bar charts.
- Leave Width at 100% unless there is a specific reason to not use the full space.
- Height (in pixels) can be adjusted if needed.
- Features and Options fields are not used at this time.