Tag: Metrics

The Gembas Role in Data Collection

Data collection can be a tricky thing, especially in a Higher Education setting. We tend to have to get creative in identifying what data would be helpful in representing improvement, as well as how we can collect the data using the resources we already have. This need for creative thinking skills tends to make brainstorming a collection plan seem ambiguous and maybe even insignificant at times.

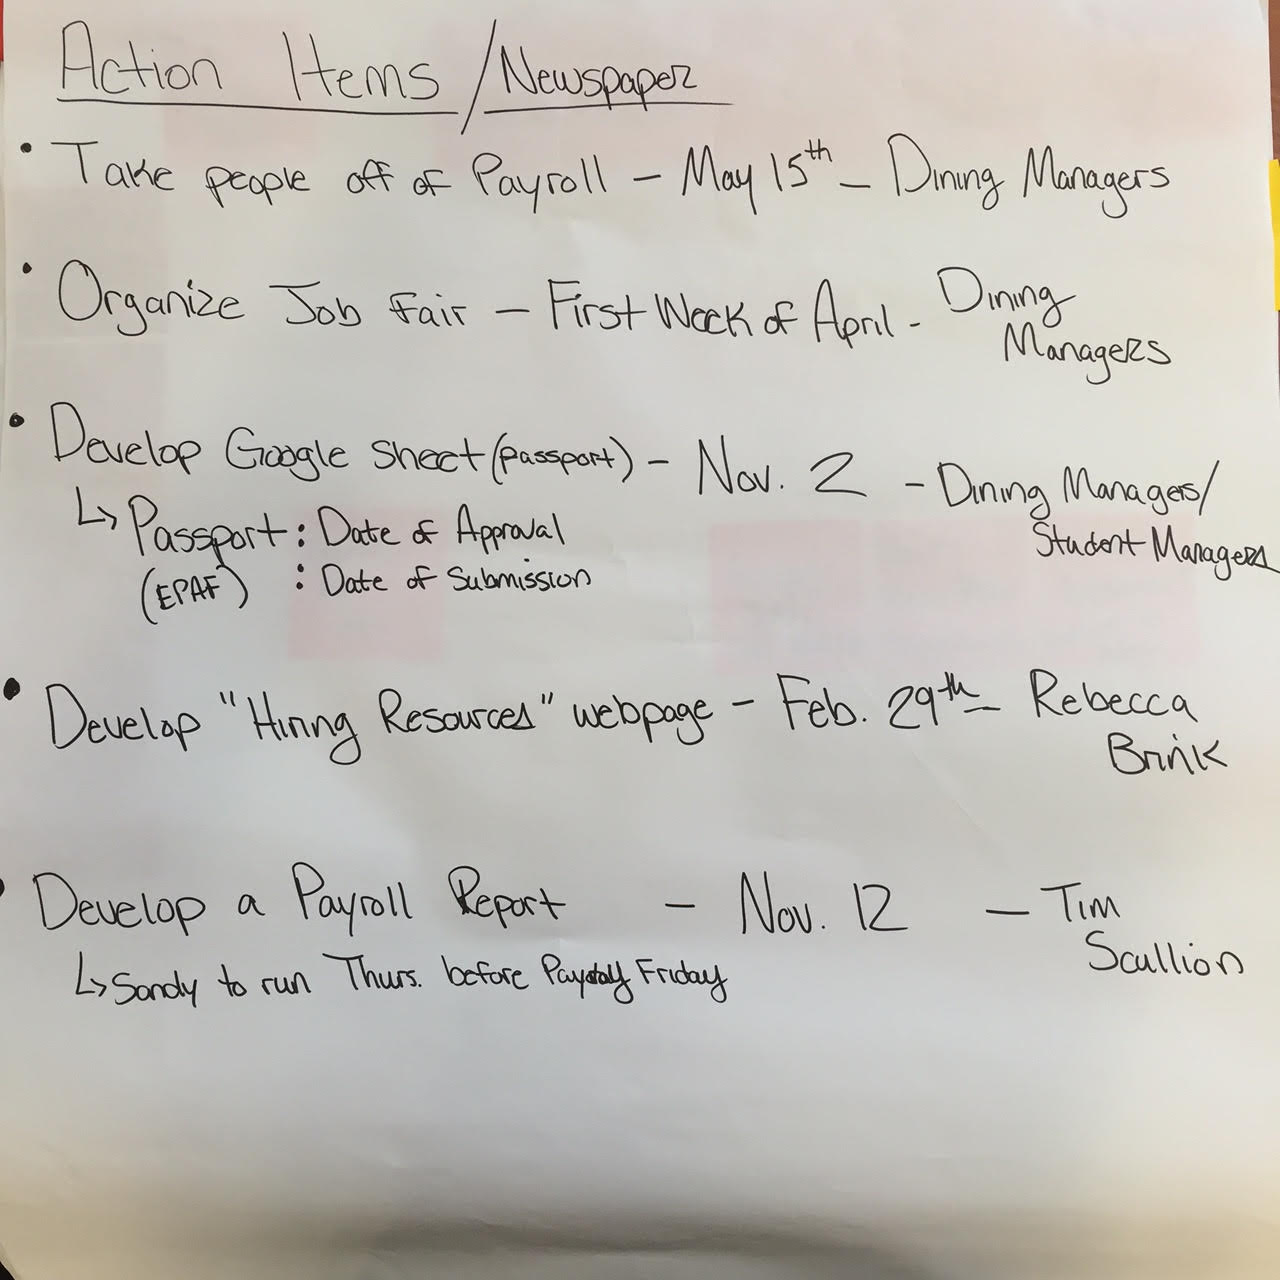
We can easily generate a process map for the current state and future state and then count how many steps were eliminated, but what if five steps were removed, and one was created? It would appear (numerically) as if four steps were removed. Which is true, but how can we account for the process change in the new step? How can we measure that the new process adds more value than the old process? How do we represent the waste of five steps versus one new step? This is where our creative thinking ends and we decide that removing four steps is “good enough.”

In a video I recently watched, Mike Wroblewski, a senior consultant from the Kaizen Institute, shared a little bit about all the things we should consider before we create a data collection plan. The part that really stuck with me was his emphasis on going to the Gemba, the place where work is done, and asking questions. Wroblewski’s video showed me, that you can’t fully grasp the current state until you immerse yourself in the environment of the user, even if it is only observation. Once you’ve gone to the Gemba, it becomes more clear what the steps in the process are. From here you can identify metrics that represent the frequency of an event, such as the number of corrections to file, or that represent importance. For example, how critical is it that this step be in the process at all.

gemba

By now you’re probably thinking, “this is all great, but why do we even care about metrics?” Results. When you think of a research project, you want to know the results. When you missed the ending of a baseball game, you want to know the results. When you hear of someone applying for a new job, you want to hear the results. We as humans are hard wired around, “what happened next?” Lean and Continuous Improvement is no exception to this. When an improvement event is initiated, we soon begin talking about data collection before and after a kaizen so that we have results to showcase the work that was done. Metrics can be the difference between a department hypothetically getting $500 towards improvement efforts or $50,000. Metrics and results drive more people to put in the energy to improve their work from good to great.

This outlook and approach towards data collection is one that our lean practitioners here on campus have been trying to implement more and more, as well creating a more systematic approach towards getting numbers easily, accurately, and that will also provide meaningful data.


Measuring Success

I recently facilitated a Kaizen project  for Dining Services that involved their student hiring process. A lot of good ideas and improvement plans came out of it, and the team was very excited about the opportunity to make this process more efficient. What stood out for me, however, was a new process step that we incorporated at the end of the Kaizen called “Measuring Success.”

As Lean practitioners we understand that metrics and data collection are pivotal to the success of any implementation initiative. However, sometimes we forget the benefits of putting these numbers on display for all to see; this group did not. We decided at the end of the day to put all of our success metrics with their respective goals and deadlines on a flip chart for each member of the team to display in their office. The motive behind this was to ensure that every day, with every decision they make, they are focused on reaching these goals.

I thought this was a fantastic idea and one that should be used in all of our projects in the future. A big part of Lean is engagement. Setting clear goals and expectations is a big factor in increasing employee engagement. When everyone is united and working toward a common goal, the opportunities for improvement are endless.

Measuring Success Flipchart


Newspaper Flipchart
Newspaper Flipchart


Lean and SMART

At some point in all of our lives we’ve had things we’ve wanted to achieve, whether it was in 1st grade and all you wanted was to be the best at shooting chocolate milk from your nose, or your very first day of college when you were determined to be “the best student you can be.” While some people would call these goals, a Lean practitioner might call them dreams. In the area of continuous improvement, goal setting is a very precise and important activity. The difference between having a dream and setting and achieving goals is what I want to focus on today.


How exactly does one go about fulfilling the dream of becoming the best student they can be or the best chocolate milk shooter? …and how is it determined? By setting SMART goals. SMART stands for specific, measurable, achievable, relevant, and time-bound. SMART goal setting helps bring substance and measurability into your goals and objectives.

Specific

When setting a SMART goal, it is important to know exactly what you want to achieve. The level of specificity you use is directly correlated to the chances of you achieving the goal.  SMART goal setting clarifies the difference between “I will be the best student I can be” and “I will do all of my homework, attend professor office hours once a week, and go to tutoring twice a week.”

Measurable

How will you feel? What will you see? How will you know when you’ve achieved your goal? With a measurable goal, there is no question as to if the goal was met. Instead of stating your goal as “being a better parent” a more measurable goal would be “spending 3 hours of one-on-one time a week with your child.”

Achievable

Can you actually do this? Your goals should always push you slightly out of your comfort zone in order to make you feel challenged. However, it is important to keep the scope small enough that you avoid becoming discouraged. The timeliness aspect of SMART goals also comes into play here. Most goals are attainable when you carefully plan your steps and give yourself a time frame that allows you to succeed. Goals that you never thought you could achieve become more realistic as you work through your plan and systematically break down any road blocks.

Relevant

Your goals need to matter. How does the goal tie into your key responsibilities? How does this goal align with the strategic goals of the organization? These are questions that need to be answered to determine whether the goal you are setting is even worth achieving. A lawyer’s goal to “make 50 peanut butter and jelly sandwiches by 2pm” may be specific, measurable, attainable and time-bound but completely lacks relevance.

Time-bound

Things are always more likely to get done when there is an established target time or date in place. When setting your SMART goals, put deadlines in place to push progress along and keep yourself, or your team, working efficiently. Deadlines, however, should always be reasonable; there’s nothing worse than feeling the pressure of an unreasonable deadline. A time frame is necessary in creating a sense of urgency within yourself; saying “I want to lose 20 lbs” is great but saying “I want to lose 20 lbs by June 1st” gives you a definitive end date to complete your goal by.

If you’re interested in a coaching session using SMART goal setting or any other continuous improvement technique(s), let us know at improvement@mtu.edu or call the Office of Continuous Improvement at 906-487-3180.

References
“Creating S.M.A.R.T. Goals.” Self Improvement and Personal Development Community. Top Achievement, n.d. Web. 31 Jan. 2015. <http://topachievement.com/smart.html>.

“SMART Goals.” Coaching Tools. YourCOACH, n.d. Web. 3 Feb. 2015 <http://www.yourcoach.be/en/coaching-tools/smart-goal-setting.php>.


Making Safety a Part of Your Lean Practice

Implementing safety and Lean together can help your organization increase productivity by reducing the wastes associated with a hazardous environment. Lean and other continuous improvement methodologies enable a safety-focused environment, by using problem solving and root cause analysis to correct the true cause of safety hazards in the workplace.

Here are some examples of how you can use Lean to make improvements to safety and increase safety awareness in your workplace:

  • Reducing excess inventory helps increase floor space and reduces potential tripping hazards. Other safety related to storage solutions might include avoiding piling boxes or other supplies on top of filing cabinets, shelves, etc.
  • While investigating workplace incidents, the “5 Whys” could be used to get down to the root causes of the accident and make improvements to prevent the error from occurring again. But remember, almost all system failures result from a combination of a number of factors and failures. You must continue to probe the circumstances, rules, policies, and people around the incident to search for all of the root causes.
  • Error-proofing can be used to avoid or prevent safety hazards.
  • Having “a place for everything and everything in its place” ensures that items are put back where they belong, and can be put back in a safe location.
  • When process mapping, safety risks can also be identified as improvement opportunities so that these risks can be mitigated.
  • Tracking  metrics related to safety can help identify any trends that may exist regarding safety incidents in order to identify opportunities for improvement.
  • Standard work can be created for workplace safety procedures in order to ensure that the task is completed safely each time.
  • Safety topics, recent safety incidents, and safety metrics can all be discussed in daily team meetings to increase safety awareness.
Example safety metric.

Those are a few examples of how an organization can make safety a part of their Lean culture. Keep in mind, a successful safety culture requires the same management support and participation as successfully making Lean a part of your organization’s culture!

Calumet Electronics Tour

Recently, Todd Brassard, Vice President/COO of Calumet Electronics, spent an afternoon giving our group a tour of their operations in Calumet, MI. During this tour, we were able to see the complex process (over 40 steps!) that it takes to produce a circuit board. In their manufacturing operations, there were several examples of Lean Manufacturing and Six Sigma in practice. I’ll talk about a few examples that we saw during our tour.

  • Many pieces of equipment had a three-color light (green, yellow, or red), that indicated the status of the machine, an example of andon.
  • Machines that drilled holes into the circuit boards automatically picked the necessary drill bit needed for the particular hole size it needed to drill, and tested the bit prior to drilling any holes into the circuit board. If a bit is damaged, then the red light on the machine comes on (andon!) so that a worker can come to the machine to inspect the bit and address the issue.
  • Workers that inspect the quality of each of the circuit boards worked in a left-to-right pattern in their work area to ensure that untested circuit boards don’t get mixed in with circuit boards that have either passed or failed the quality inspection (error proofing); only the boards that had passed the inspection made it into the stack on the far right of their work area. These workers also test the circuit boards in small batches of 25 that their computer confirms the count of; this ensures that the whole stack of 25 has been inspected before the next batch can be tested. The computer also says, in clear and large text, “Pass” in green or “Fail” in red (a visual control) when telling the worker the results of the inspection.
  • Todd also noted that for many of their process, they are tracking Cpk, which is the actualized process capability. As a rule of thumb, a Cpk of at least 1.33 indicates a capable process.
  • At the end of the tour, Todd showed our group some awesome data collection and metrics that they’ve begun keeping to track the “health” of their business. To the “data geeks” among us, this was pretty neat!