Tag: Visual Control

Wedding Bells Are No Exception

So often we get caught up in our projects: we start them, prioritize them, and then devote all of our attention to them one by one until they’re completed. We very rarely have a single project that is on-going for a long period of time; why is this?

I think it’s because we don’t want lingering work, we thrive off of completion. From that we gain satisfaction and pride in our work.

There is, however, a trade-off for this pride. That is, when we continuously move from one project to the next, seeing each to completion before starting the next, most of us quickly become burned out. When we get burned out we lose our energy and our enthusiasm, as well as become negative, frustrated, and unproductive. That satisfaction we were chasing before no longer sustains us.

Back in February, one of my co-worker’s blogged on incremental improvement, and recently she blogged about Preemptive Improvement. In these blogs, she’s shared how our office has been using small improvements to achieve a high future state and strive for perfection, even when a correction isn’t necessary. These methods are some that I’ve been applying in my own personal life heavily in the last year or so.

Last July I got engaged, we set a date 11 months out and so commenced the wedding planning. For all those who’ve been married, you probably know the magnitude of this task. I’ve always been a “planner,” per say, and I tend to enjoy getting to use my creativity, so from the beginning I’ve been pretty excited about the planning process. However, I know a lot of people who’ve gotten married and I’ve learned that the entire process isn’t always fun, or creative. I also know myself and I tend to go and go and go, and focus on one thing until it’s complete before I’ll start the next; meaning, I tend to burn myself out.

Knowing the planning wouldn’t always play on my interests, and knowing that I sometimes overburden myself were good things to be aware of back in July. Because of this, I was able to plan ahead and use my lean thinking skills to combat potential burnouts or becoming a bridezilla (my worst nightmare). I did this by utilizing the skills I’ve learned here in the Office of Continuous Improvement. I can honestly, say with 10 days left until the wedding, that I’ve only had two “burnouts,” one as a result of over-processing, and the other was out of my control to change.

After talking to multiple soon-to-be wives, I’ve learned that I am the one who’s been the least bit stressed about the planning process as a whole and I believe this is from all of the lean I’ve implemented… From organizing my thoughts via a gigantic affinity diagram, laying out the roles and responsibilities of our family members in a swim lane, using a decision matrix to decide on venues and vendors, ICE prioritization of tasks, plentiful checklists, recognizing when I was over processing, and also taking it one step at a time and remembering that the entire wedding doesn’t need to be planned over-night.

I’ve also gathered that on average, the last three weeks before the wedding tend to be the busiest with wrapping up small details. However, because of the prioritization that we conducted early on, and the small deadlines we set, we were able to spend two of those weeks towards something not related to wedding, and only spend the last week wrapping up details.
34643065_10204681238907051_8619962606741880832_n (1)
This is the original affinity diagram that kicked off the planning (kind of) last August. Things would get added and removed as we moved, but at one point it took up this entire 10 ft wall.

The purpose of today’s blog post is to show you that as long as you learn how to slow down your thinking, anyone can implement and benefit from small improvements striving for perfection.


Visual Management Workshop

The Office of Continuous Improvement is hosting another workshop. This time the topic is visual management. Visual management is where information is communicated by using visual signals instead of texts or other written instructions. The design allows for quick recognition of the information being communicated in order to increase efficiency and clarity. Visual controls also make problems, abnormalities, or deviations from standards visible so corrective action can take place immediately.

The visual management workshop will take place Tuesday, March 24th and Wednesday, March 25th. For more information or to sign up, visit the improvement website.

Visual 2

Menlo Innovations’ Business Value of Joy Workshop

Thank you to our returning guest blogger, Kaylee Betzinger, a former student process improvement coordinator here at Michigan Tech and currently an intern at Amway in their Enterprise Excellence Department.

Menlo Innovations Daily Stand UpI recently had the opportunity to go on an industry tour to Menlo Innovations. Menlo Innovations is a custom software development company that utilizes a High-Tech Anthropology approach and incorporates continuous improvement principles in their day-to-day activities to develop and build new and innovative programs for their customers. Richard Sheridan, Menlo’s founder and CEO, is the author of Joy Inc. (How We Built a Workplace People Love). Menlo has won numerous awards, including Inc.’s 500 Fastest Growing Private Companies in American (Inc. Magazine), 101 Best and Brightest Companies to Work For (Metro Detroit), and the Alfred P. Sloan Award for Excellence in Workplace Flexibility (When Work Works).

A hot topic lately at Amway has been Visual Management. Several different departments at Amway Headquarters have expressed interest in Visual Management, so we (Enterprise Excellence) thought, what better way to teach Visual Management than to go to a world renowned company that is known for their culture and visual workspace (AKA, go to the Menlo Innovation Gemba). Menlo welcomes companies to come in and take one of the many tours or workshops available and learn more about what it means to have Joy in the workplace. We were able to take the Menlo Innovations Business Value of Joy Workshop, which is a private workshop geared toward a topic of our choosing (Visual Management) and is given by one of the partners.

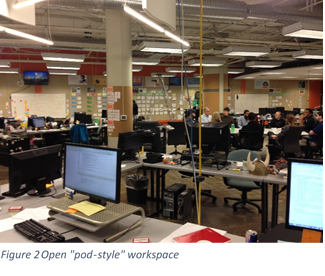
James Goebel, Menlo’s Chief Architect and a Partner was our workshop facilitator. Before our tour even began we were able to participate in their companywide daily standup meeting. Their daily stand up (see Figure 1) takes place every morning at 10:00 am. Everyone gets up from what they are doing, forms a large circle, and explains what they will be working oMenlo Figure 2 Open Workspacen for the day and if they are in need of any assistance from other team members. I was astounded that everyone was able to participate (60+ employees) and keep it under 10 minutes. What a great way to kick-off our workshop!
After the stand-up, James began talking about the Menlo culture and the
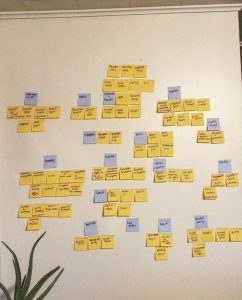
different behaviors they’ve incorporated, such as an open and collaborative workspace (no walls, cubicles, or designated stations/desks, see Figure 2), estimation without fear, and making mistakes faster. Making mistakes faster is (what I believe) a key in any continuous improvement culture, so I inquired further and James explained that you have to create an environment where problems are obvious. When the problems are obvious and visual, you can fix them and generate results much quicker. A perfect example of this is in their Weekly Project Tracking Board (see Figure 3). For each day of the week they’ve laid out exactly what each project pair will be working on, on what they call a story card. The story cards are a simple, Menlo Figure 3 Project Trackerhand written description of what is needed for this piece of the project, an estimation of how long this will take, and a status in the form of a colored dot. They have 5 different colors with a different meaning for each (as seen in the upper right hand corner of each story card). The colors and meanings are as follows: yellow—currently in process, orange—done in the eyes of the team and waiting for QA approval, red—needs additional attention, question/need assistance, or waiting for a response from the client, green—completed, and blue—cancelled. This project tracker is an extremely simple and effective way to track projects. Anyone in the building can walk over to the board and see the progress on any given project.

Anywhere you look in the building you can see how Menlo has integrated visual management and visual cues. You can feel the Joy in the air when you walk in, and that is something to be cherished and striven for. I would recommend taking a Menlo tour to anyone interested in learning more about a continuous improvement culture and what it looks like to have Joy in the workplace (plus you get a copy of Rich Sheridan’s Joy Inc.).


Sponsored Programs Kanban

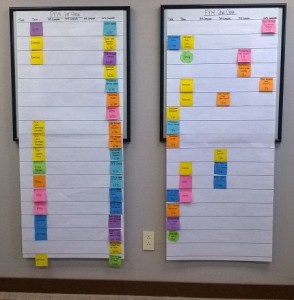
Sponsored Programs Kanban for the end of the fiscal yearMichigan Tech’s Sponsored Programs uses a Kanban to keep track of all the tasks they need to complete at the end of the fiscal year. A Kanban is a visual management tool that shows you the status of a process at a glance. The university has two financial closes for the fiscal year–one on June 30 and a final close around the second or third week in July. This Kanban helps them keep on track. They review and update it in their daily 15 minute group-ups. Each horizontal space represents a task that must be completed. Each task and associated team are written on sticky notes. A task which has not been started is placed on the far left. The responsible team is next to it. As the task is completed it’s moved to the right, first to 25% complete, then 50%, 75%, and finally, 100% complete. Any person in the office can look at this Kanban and know what’s complete, what needs to be done, and who might need some help. Tammy LaBissoniere, a Lean Implementation Leader in Sponsored Programs, uses Kanbans to keep track of several different processes. Talk with her if you think this might work for you. Or contact our office anytime!

The Lean Help Loop

The Lean Help Loop
The Lean Help Loop

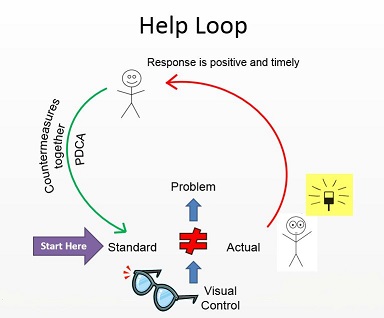
When you’re improving a process, it’s important to make sure a help loop is in place. The help loop ensures that when employees encounter a problem they can’t fix themselves, someone will come and help. Without a help loop, the improvement will not be sustained.

Your most important processes should have both a Standard and a Visual Control. Establish a Standard so that it’s easy to see when the actual outcome doesn’t equal the expected outcome. Then create a Visual Control that allows everyone to easily know if the process is working properly (called an Andon). It  needs to be updated only as often as management is willing to both check it and take action if something is wrong. The Visual Control isn’t just for information. If actual is not equal to standard, management must not only respond, they also have to respond in a positive and timely manner. At this point, supervisors work through the problem with their employees, using the Plan-Do-Check-Adjust (PDCA) model, to develop countermeasures that will fix the problem, bringing the process back to Standard.

Lean Best Practices are Everywhere… Once You Learn to See Them

We are pleased to present this guest blog by Rick Berkey, Research Engineer II and Product Development Manager, as well as a campus Lean Facilitator.

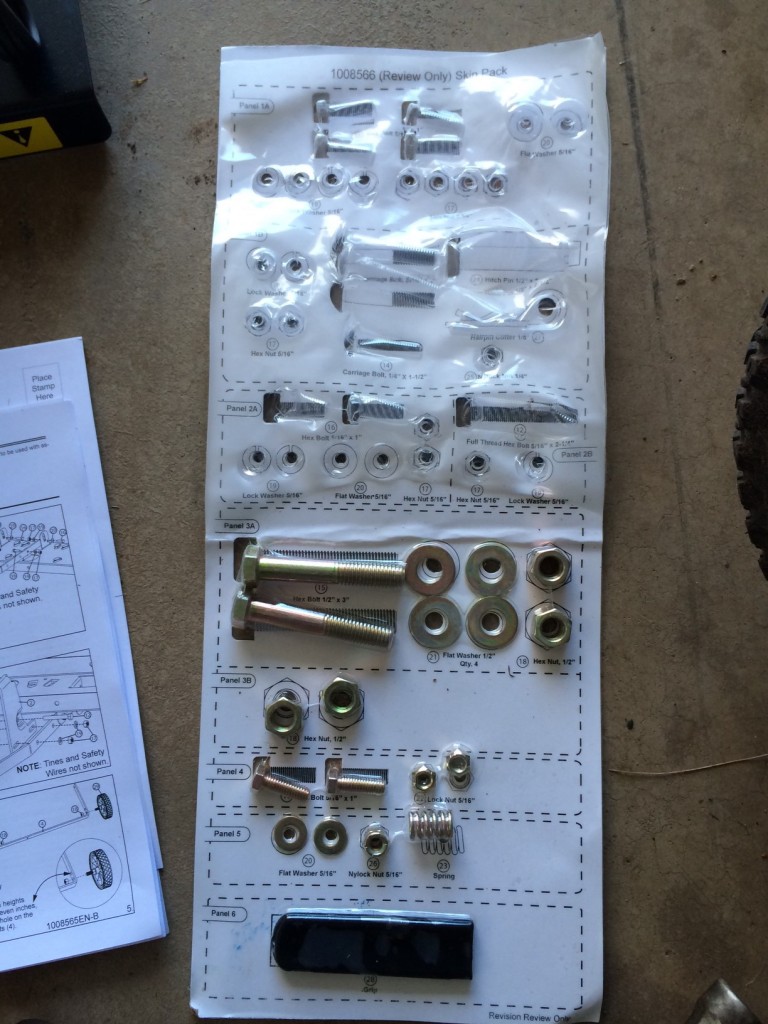
I recently purchased a lawn dethatcher online and was anxious to assemble it when I got home from work yesterday. When I opened the package, I was expecting the usual bag of parts and fasteners that fly everywhere when you rip open the industrial strength plastic packaging. If you’re like me, you also know instructions can be more like ‘suggestions’ — you look at bad illustrations, use your judgment, sort through parts that look close enough, skip important steps because you think you know the correct way, then take things apart once you realize you really don’t… and of course you end up with missing pieces or extra parts that you store as ‘just in case’ inventory. If only we had enough ‘junk drawers’ in our homes!

Instead, I was pleasantly surprised to find a great application of Lean (see image). All parts and fasteners are arranged on a ‘shadowboard’. Each panel was clearly labeled according to the sequential assembly steps provided in the instruction sheet. This simple yet effective solution highlights several Lean principles. First, it is centered around defining value in the eyes of the customer – i.e. making it easier for the person assembling it. Second, it embraces the 5S concept of establishing ‘a place for everything and everything in its place’. Third, it serves as an effective visual control for the assembly process.

As the customer, I experienced several benefits and hence derived value as follows:

1. Knowing I had all the parts BEFORE I began…and if for some reason a part were missing, it would be obvious at the start

2. It was difficult NOT to follow instructions…the shadowboard keeps you on task. This can also be seen as an example of Poka-Yoke or mistake proofing

3. Faster assembly time, by reducing the following wastes: motion (looking for parts), defects (using wrong parts for a given step)

4. No missing/extra parts at the end…wow!

Kudos to Brinly-Hardy for getting it right with their product. The time and aggravation I saved was channeled into USING the product…after all, the goal was to dethatch my lawn, not assemble a dethatcher. Now, I know we’re not assembling dethatchers here on campus (well, maybe the Grounds department is!), but I would challenge all of us to see how these principles can and do apply to the things we do every day. Some questions to consider in your daily work: Who is your customer, and how to they define ‘value’? Is your work helping to create value or is it creating additional waste? Is there a visual solution that can streamline the process? When you develop and improve work processes, have you considered mistake proofing methods to make it easier to do it right the first time (by making it hard to do it incorrectly)?


Feel free to comment, and in the meantime I need to finish raking all that dead grass!

The shadowboard that helped error proof dethatcher assembly.

Calumet Electronics Tour

Recently, Todd Brassard, Vice President/COO of Calumet Electronics, spent an afternoon giving our group a tour of their operations in Calumet, MI. During this tour, we were able to see the complex process (over 40 steps!) that it takes to produce a circuit board. In their manufacturing operations, there were several examples of Lean Manufacturing and Six Sigma in practice. I’ll talk about a few examples that we saw during our tour.

  • Many pieces of equipment had a three-color light (green, yellow, or red), that indicated the status of the machine, an example of andon.
  • Machines that drilled holes into the circuit boards automatically picked the necessary drill bit needed for the particular hole size it needed to drill, and tested the bit prior to drilling any holes into the circuit board. If a bit is damaged, then the red light on the machine comes on (andon!) so that a worker can come to the machine to inspect the bit and address the issue.
  • Workers that inspect the quality of each of the circuit boards worked in a left-to-right pattern in their work area to ensure that untested circuit boards don’t get mixed in with circuit boards that have either passed or failed the quality inspection (error proofing); only the boards that had passed the inspection made it into the stack on the far right of their work area. These workers also test the circuit boards in small batches of 25 that their computer confirms the count of; this ensures that the whole stack of 25 has been inspected before the next batch can be tested. The computer also says, in clear and large text, “Pass” in green or “Fail” in red (a visual control) when telling the worker the results of the inspection.
  • Todd also noted that for many of their process, they are tracking Cpk, which is the actualized process capability. As a rule of thumb, a Cpk of at least 1.33 indicates a capable process.
  • At the end of the tour, Todd showed our group some awesome data collection and metrics that they’ve begun keeping to track the “health” of their business. To the “data geeks” among us, this was pretty neat!