A warm welcome to our new guest blogger, Jim Desrochers. Jim is the Associate Director for Employer Relations in Michigan Tech’s Career Services. He is also training to become a campus Lean Facilitator.
In a manufacturing setting, waste is measured in terms of factory efficiency and scored by the accounting measurement system as part of the financial reporting process. In an office setting, these measurements are harder to define but they “show up” in wasted effort, frustration, frayed nerves, and people staying late to help make the event a success.
Our Career Services group is known for coordinating our bi-annual Career Fairs. Managing logistics for hundreds of companies, nearly a thousand recruiters, and several thousand students leaves very little room for error. Most importantly, the future careers of our students are on the line. With the economy improving and the excellent reputation of Michigan Tech students, the size and expectations for Career Services events have continued to grow.
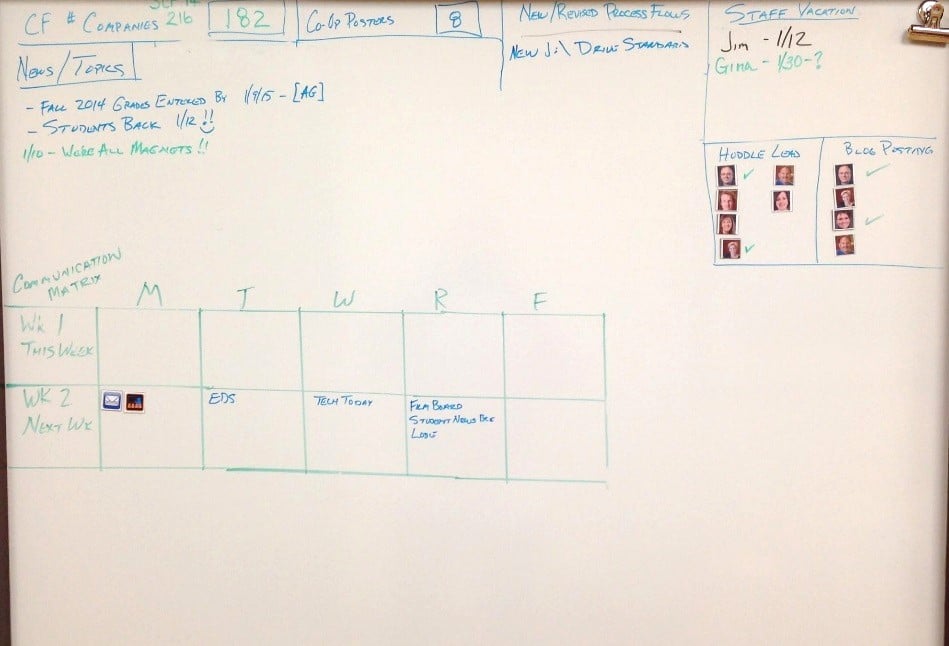
As our department’s first step in our lean journey, we decided to start a morning huddle. Initially, the primary focus of the meeting was our event-planning calendar. This grid is a look ahead for the next few weeks to ensure everyone in the department knows what is coming next. To make this happen, we repurposed a dry erase board and moved it to a central area. A few dry-erase markers later, we had the beginnings of a communication structure!
In an office where everyone is extremely busy, we had reservations about everyone sacrificing 10 minutes of their day. We also were concerned that we would not know what to talk about! These concerns turned out to be unfounded! After a month of using this new process, the information on the dry erase board has changed. Some things we initially placed on the board aren’t used anymore and we simply erased them. New items are added as we develop new educational programming. Using only markers and bad penmanship, the board continues to be dynamic. We are starting to use rulers and magnets to make the look neater – but we don’t want to lose the flexibility of just getting the information communicated.
Our implementation of Lean Initiatives in our offices continues as time allows. As we continue to add process improvements, these items will find their way back to the central huddle board. It will be interesting to see what the board looks like a year from now!


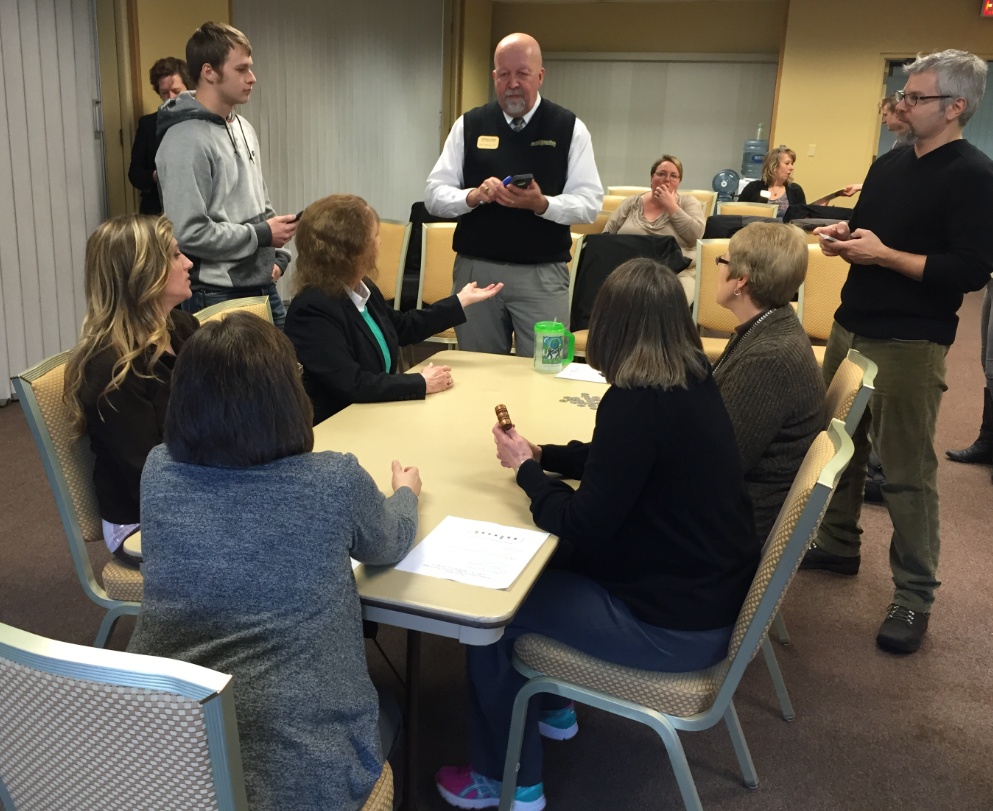

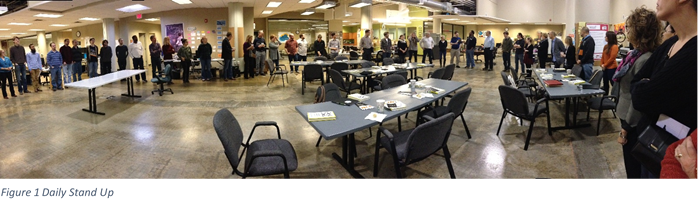
 n for the day and if they are in need of any assistance from other team members. I was astounded that everyone was able to participate (60+ employees) and keep it under 10 minutes. What a great way to kick-off our workshop!